
GE Vernova Stumbles: 1% Slide Signals Technical Exhaustion Amidst Sector Stagnation
 Aime Summary
Summary
• GE VernovaGEV-- (GEV) closes intraday at 990.505, down 0.98% from the previous close of 1000.3.
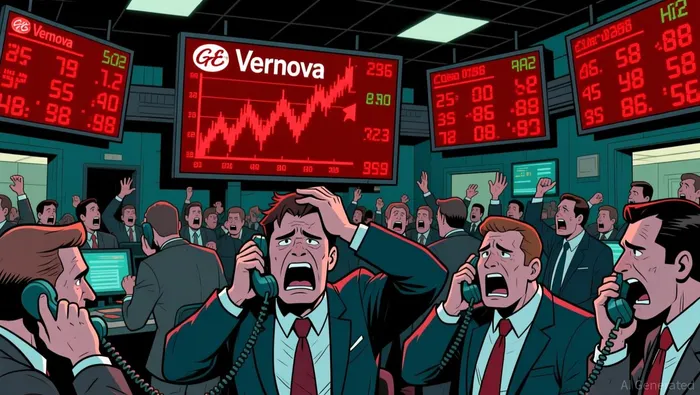
• The stock opened strong at 1013.2 but faced immediate selling pressure, dipping to an intraday low of 963.55 before recovering slightly.

• Technical indicators paint a conflicting picture, with the 52-week high sitting at 1195.94 while the 52-week low rests at 530.16, highlighting significant volatility.
GE Vernova’s intraday performance reflects a classic case of profit-taking and technical correction. After opening near the day's high, the stock failed to sustain momentum, sliding nearly 1% as traders reassessed the short-term trend. The wide trading range between the open and low suggests indecision among market participants, with volume turning at a modest 894,039 shares.
Technical Correction Triggers Intraday Sell-Off
The decline in GE Vernova is primarily driven by technical factors rather than fundamental news, as no significant company-specific updates or sector-wide disruptions were reported during this session. The stock opened at 1013.2, testing the upper boundary of its recent consolidation, but quickly faced resistance. The failure to hold above the 1000 psychological level triggered algorithmic selling and profit-taking from investors who had accumulated positions near the 52-week highs. The subsequent drop to 963.55 indicates a loss of bullish conviction in the short term, with the stock struggling to find a floor above the critical 960 support zone. This move is a natural correction within a broader ranging pattern, as the stock attempts to digest its recent gains and realign with its moving averages.
Electrical Components Sector Shows Uniform Caution
GE Vernova’s movement mirrors the broader sentiment in the Electrical Components & Equipment sector, where momentum appears muted. Sector leader Everest Metals (EMC) posted a negligible decline of -0.00441185%, indicating that the sector is not experiencing a broad-based rally or crash. This lack of sector-wide leadership suggests that GE Vernova’s decline is idiosyncratic, driven by its own technical structure rather than a systemic issue in the electrical components industry. Investors are likely waiting for clearer directional signals from the sector before committing to new positions, leading to the cautious, range-bound trading observed today.
Technical Analysis Dictates Cautious Stance Amidst Range-Bound Action
The technical landscape for GE Vernova presents a complex environment for traders, characterized by mixed signals that require a nuanced approach. Key technical indicators suggest a short-term bearish bias within a long-term ranging context.
• MACD: -14.45 (Signal Line: -14.24, Histogram: -0.21) – The MACD line is below the signal line, and the negative histogram indicates weakening bullish momentum and potential for further downside.
• RSI: 43.29 – The Relative Strength Index is in neutral-to-weak territory, suggesting the stock is neither overbought nor oversold, but lacks upward momentum.
• Bollinger Bands: Upper 1114.51, Middle 1019.73, Lower 924.94 – The price is trading below the middle band, indicating short-term bearish pressure, but remains well within the bands, suggesting no extreme volatility.
• Moving Averages: 30-Day (1047.51), 100-Day (1006.89), 200-Day (844.40) – The stock is trading below both the 30-day and 100-day moving averages, which act as immediate resistance, but remains above the 200-day average, providing a long-term support floor.
Given the technical setup, the trading strategy should be cautious. The stock is currently trapped between the 30-day resistance at 1047.51 and the 200-day support zone of 573.04–585.57. With no leveraged ETF data available, traders should focus on the stock’s own technical levels. The immediate focus should be on whether the stock can hold above the 963.55 low; a breakdown below this level could accelerate selling towards the lower Bollinger Band at 924.94. Conversely, a recovery above the 1000 level is needed to regain short-term bullish sentiment.
As the options chain is empty, we cannot provide specific options picks. However, traders should monitor implied volatility for potential spikes if the stock breaks key support. The absence of options data suggests lower liquidity in derivatives, which may widen bid-ask spreads and increase execution costs for options traders.
Aggressive traders may consider short positions if the stock fails to reclaim 1000, targeting the 963.55 low. Conversely, conservative investors should wait for a confirmed breakout above the 100-day moving average at 1006.89 before adding to long positions.
Conclusion: Stay Defensive as GE Vernova Tests Key Support Levels
GE Vernova’s recent price action highlights the need for vigilance as the stock navigates a critical technical juncture. The decline from 1013.2 to 990.505, coupled with the weak MACD and RSI readings, suggests that the short-term trend is bearish. While the long-term trend remains ranging, the stock’s position below its 30-day and 100-day moving averages indicates that buyers are currently on the defensive. The sector leader, Everest Metals (EMC), with a price change of -0.00441185%, reflects the broader market’s lack of enthusiasm for the sector, further dampening GE Vernova’s upside potential. Investors should monitor the 963.55 support level closely; a break below this level could trigger a more significant sell-off. Conversely, a recovery above 1000 is necessary to restore confidence. Until then, the best strategy is to wait for a clear directional signal before committing capital. Watch for $963.55 breakdown or a breakout above $1006.89 to determine the next move.

TickerSnipe provides professional intraday stock analysis using technical tools to help you understand market trends and seize short-term trading opportunities.
Latest Articles
Stay ahead of the market.
Get curated U.S. market news, insights and key dates delivered to your inbox.


AInvest
PRO
AInvest
PRO




Comments
No comments yet