
GBX's 8% CEO Drop Meets the Line That Separates Capitulation From a Deeper Slide
 Aime Summary
The chart for The Greenbrier CompaniesGBX-- (NYSE: GBX) tells a story of relentless erosion — and then, three days ago, another sharp crack. Shares fell 8% on September 1 when the company announced CEO Lorie Tekorius will retire January 6, 2027. That single-day move was unusual even for a stock that has spent most of the year in decline; over the past twelve months, only seven bars have moved more than 5%. GBXGBX-- is not a stock that normally throws tantrums. When it does, it usually means something structural is shifting.

The shares now sit at $43.26, just above the $42.50 low they printed that same session. This is not a round number. It is the floor buyers have defended twice in the past week, and it sits only $0.30 above the prior-day close before the CEO news hit. Everything between here and the 52-week low of $38.23 — roughly 11% of further downside — has already been tested and rejected once this year. The question is whether $42.50 marks the point where sellers have no one left to hunt, or whether it is merely the last step down before the stock revisits its lows.
The Downtrend That Built This Moment
Greenbrier is down roughly 27% from its 52-week high of $59.19 in February. The decline is not a single event but a cascade: fiscal-year revenue fell 22.9% year over year in the most recent reported quarter, backlog dropped to approximately 13,800 units — the lowest level since 2010 — and management cut full-year revenue guidance from a $2.95 billion midpoint to $2.45 billion. Susquehanna downgraded the stock from "Positive" to "Neutral" in July, citing a lack of visibility on order improvements and tariff clarity. Wall Street consensus now reads as a moderate sell.
The stock has been below its 50-day moving average of $47.54 and its 200-day moving average of $49.34 for weeks. The MACD is deeply negative. Over the last 20 trading days, GBX is down 8.4%. Over 120 days, it is down 16.7%. This is a stock in a sustained downtrend, and the chart does not lie about direction.
But a downtrend does not mean the price keeps falling in a straight line — and it does not mean every decline carries the same character.
The Oversold Angle: What the RSI and Capital Flow Say
Here is where the chart gets interesting. The 14-day RSI sits at 34.75, which is oversold territory. It is not at the extreme — a reading below 30 would suggest near-term exhaustion — but it is close enough that the stock has compressed into a zone where the natural buyer-seller dynamic shifts. Sellers are not necessarily wrong about Greenbrier's fundamentals, but they have been right for long enough that fewer sellers remain willing to add to positions at these levels.
Capital flow data from the latest session confirms a broad sell-off: block outflows exceeded inflows (101K versus 86.2K shares), and retail outflows topped inflows (480.8K versus 378.3K). Medium orders were the only bright spot, with net inflow of roughly 62K shares. That tells you the selling has been institutional and broad-based, not a coordinated short squeeze or a single large seller dumping inventory. It is a consensus decline — which makes the question of whether it has run its course even more important.
The Floor Under the Business — And the Stock
Greenbrier is not just a manufacturer. Its leasing and fleet management segment, which owns roughly 20,600 railcars, generates recurring revenue with a 98-99% utilization rate. That fleet acts as a business floor: even when new railcar orders dry up, the lease portfolio keeps producing. Management plans to invest up to $300 million annually in expanding it, funded by $887 million in liquidity. The company also just raised its quarterly dividend for the 48th consecutive quarter — a 6% increase to $0.34 per share. Dividend increases during a downturn are not automatic. They are a signal that management sees cash flow continuity despite the cyclical weakness.
The leasing floor translates into a stock-floor mechanism. At current levels, GBX trades at roughly 14 times earnings and has a book value of approximately $50.85 per share — meaning the stock is already below its stated book value. A stock trading below book during a cyclical trough often means the market has priced the business as if it were worth less than its assets. That can be correct if asset values are impaired, but it is a level that tends to attract patient capital.
The Line That Matters: $42.50
This is the level the chart reduces to. $42.50 was the session low on September 1, the day of the CEO announcement and the 8% drop. The stock opened at $42.56 that morning — barely above the close of the previous day at $42.79 — and spent the day trying to find a floor. It found one at the open. Two days later, on September 5, it traded up 1.1% to $43.26, suggesting buyers stepped in rather quickly after the initial shock.
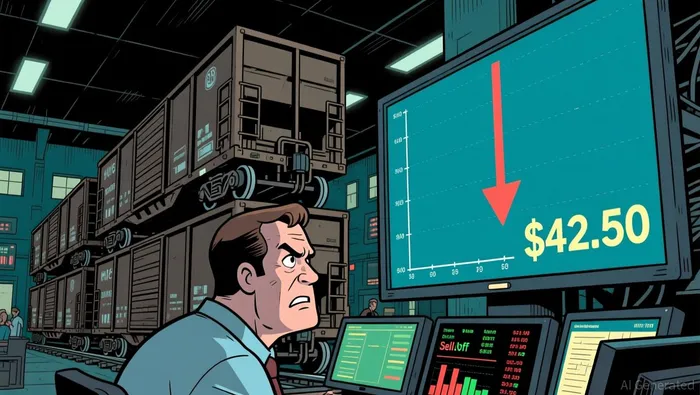
If $42.50 holds, the argument is that the CEO news was already priced and the broader selloff has pushed into oversold territory with no new catalyst to justify further decline. From here, the stock would face resistance at the 50-day moving average around $47.50, roughly 10% above current levels. A reclaim above $45 — the prior support level that broke in August — would strengthen the bounce thesis.
If $42.50 breaks, the path to the 52-week low of $38.23 is clear. There is no dense support zone between $42 and $38. The stock tested $38-39 in early 2026 and bounced, but the low itself has not been revisited since. A break below $42 would put the stock within striking distance of that test, and given the backdrop of a 10-year-low backlog and analyst downgrades, nothing would mechanically stop it.
The Decision Map
| Scenario | Trigger | Upside Path | Downside Path | Invalidation |
|---|---|---|---|---|
| Bounce | Hold $42.50, reclaim $45 | Resistance at $47.50 (50-day MA), then $50 | Break below $42.50 | Close below $38 |
| Breakdown | Break $42.50 | Recovery above $45 negates the break | 52-week low at $38.23 | Hold above $42.50 for 3+ sessions |
The horizon is medium: the next earnings report and any guidance revision will reset the thesis more decisively than intraday levels. Until then, the chart is telling you where the near-term supply and demand battle is taking place.
The Verdict
Greenbrier is a stock trading below book value, at an oversold RSI, with a business floor in its lease portfolio — and simultaneously in a 27% downtrend, with a 10-year-low backlog, an incoming CEO, and Wall Street telling you to sell. Both sides of that tension are real.
Hold $42.50 and the oversold bounce toward $47 remains in play. Lose $42.50 on expanding volume and the $38 low is the next level that matters. The chart does not care about the CEO's retirement date. It cares about whether buyers show up at $42.50 and hold the line.

Stay ahead of the market.
Get curated U.S. market news, insights and key dates delivered to your inbox.


AInvest
PRO
AInvest
PRO




Comments
No comments yet