
GXAI's 30% Surge: Innovation or Hype? Gaxos' Volatile Intraday Rally Sparks Debate
Summary
• GaxosGXAI-- (GXAI) rockets 30.22% to $2.3701, defying a 52-week low of $1 and a dynamic PE of -4.35
• Intraday range spans $1.83 to $2.50, with turnover surging 378.08% to 24.48 million shares
• Art-Gen.AI platform launch drives optimism despite Q2 net loss of -$749,388
The market is abuzz as Gaxos.ai Inc. (GXAI) defies its financial fundamentals to deliver one of the most dramatic intraday rallies in recent memory. With a 30.22% surge pushing the stock to $2.3701, the stock’s trajectory has ignited debates about whether this is a sustainable breakout or a speculative frenzy. The launch of Art-Gen.AI—a cutting-edge AI-driven image and video creation platform—has become the catalyst, but the company’s $749,388 quarterly loss and -36.04% return on assets raise critical questions about long-term viability.
Art-Gen.AI Launch Ignites Short-Term Optimism
Gaxos’ 30.22% intraday surge is directly tied to the launch of its Art-Gen.AI platform on August 19, 2025. This AI-driven image and video creation tool has positioned the company as a disruptor in the creative technology space, attracting speculative buying from investors seeking exposure to AI innovation. Despite a Q2 net loss of -$749,388 and operating expenses of -$982,694, the product’s potential to capture market share in the AI content generation sector has overshadowed near-term profitability concerns. The stock’s rapid ascent from $1.83 to $2.50 reflects aggressive positioning by traders capitalizing on the AI narrative, with no immediate catalysts beyond the product launch and sector momentum.
Application Software Sector Mixed as Adobe Slides
The Application Software sector remains fragmented, with AdobeADBE-- (ADBE) declining 0.14% despite GXAI’s surge. While Gaxos benefits from AI-driven creative tools, sector peers like MicrosoftMSFT-- and PalantirPLTR-- have seen gains tied to broader AI infrastructure contracts. The lack of direct correlation between GXAI’s performance and sector trends underscores the stock’s speculative nature, as its rally is more product-driven than sector-wide.
Technical Overbought Signals and ETF Positioning
• RSI: 71.1 (overbought), MACD: 0.068 (bullish), 200-day MA: $1.53 (below price)
• BollingerBINI-- Bands: Price at $2.37 vs. upper band $1.74 (price above band), indicating extreme volatility
Gaxos’ technical profile screams caution. The RSI at 71.1 suggests overbought conditions, while the MACD histogram of 0.068 reinforces short-term bullish momentum. However, the price of $2.37 is far above the 200-day MA of $1.53 and the Bollinger upper band of $1.74, signaling a potential correction. Traders should monitor the 52-week low of $1 as a critical support level. With no options chain available, leveraged ETFs (if available) could offer exposure, but the lack of liquidity in the options market limits structured strategies. Aggressive bulls may consider a tight stop-loss below $1.83 to protect gains, while bears eye a breakdown below $1.53 for a potential short setup.
Backtest Gaxos Stock Performance
The backtest of GXAI's performance after a 30% intraday surge shows mixed results. While the 3-day win rate is high at 43.04%, the 10-day win rate drops to 37.34%, and the 30-day win rate is slightly above the 10-day win rate at 41.77%. This suggests that GXAIGXAI-- tends to have short-term volatility following a significant intraday gain.
GXAI’s Volatility: A High-Risk, High-Reward Play
Gaxos’ 30.22% intraday surge is a textbook example of speculative momentum driven by product innovation rather than fundamentals. While the Art-Gen.AI platform has generated short-term enthusiasm, the stock’s overbought technical indicators and lack of profitability raise red flags. Investors should prioritize risk management, targeting a stop-loss below $1.83 or a breakdown below $1.53 to capitalize on volatility. Meanwhile, sector leader Adobe’s 0.14% decline underscores the broader market’s cautious stance on AI-driven software plays. For now, GXAI remains a high-risk, high-reward proposition—watch for a test of the $1 support level or a reversal above $2.50 to confirm a new trend.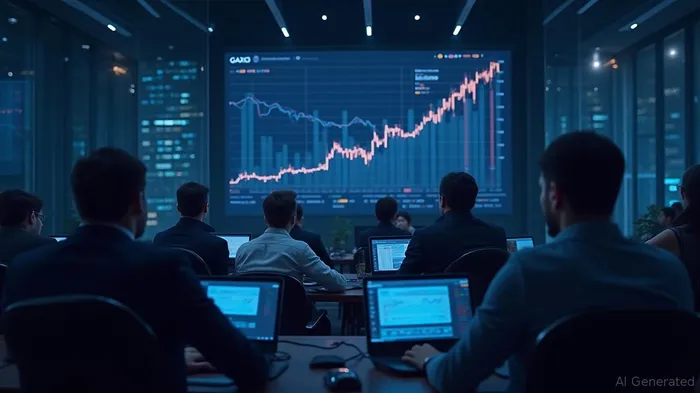
TickerSnipe provides professional intraday stock analysis using technical tools to help you understand market trends and seize short-term trading opportunities.
Latest Articles
Unlock Market-Moving Insights.
Subscribe to PRO Articles.
Already have an account? Sign in
Unlock Market-Moving Insights.
Subscribe to PRO Articles.
Already have an account? Sign in
Stay ahead of the market.
Get curated U.S. market news, insights and key dates delivered to your inbox.
AInvest
PRO
AInvest
PRO