
FTT's 26% Surge: Key Technical and Market Signals Before the $1.30 Psychological Hurdle


The FTX TokenFTT-- (FTT) has ignited a 26% rally in a single trading session, breaking out of a prolonged consolidation triangle and testing the $1.30 psychological barrier—a level that has historically defined its price trajectory. This surge, fueled by a confluence of technical and on-chain signals, has reignited bullish sentiment among traders and institutional players alike. However, the path forward remains fraught with volatility, and the $1.30 threshold will serve as a critical litmus test for the token's long-term recovery.
Technical Catalysts: Breakout and Momentum
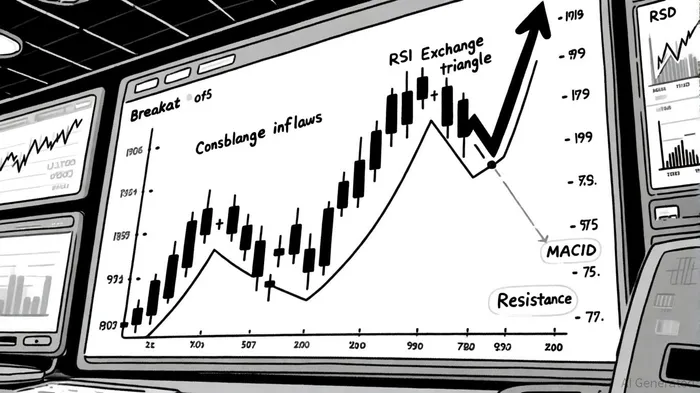
FTT's breakout from a consolidation triangle on September 19, 2025, marks a pivotal shift in its technical structure. According to a report by Ambcrypto, the pattern's completion—confirmed by a close above the $1.00 resistance—has triggered a surge in bullish momentum[1]. The MACD histogram has expanded into positive territory, while the RSI stands at 68.63, indicating neutral-to-bullish positioning[2]. Crucially, FTTFTT-- is trading above its SMA 7, SMA 20, and SMA 50, reinforcing the strength of the upward trend[2].
The next critical juncture lies at $1.30, a level that has historically acted as both a support and resistance. A sustained close above this threshold could invalidate prior rejection patterns and open the door to a retest of the 52-week high of $2.68[1]. However, traders must remain cautious: the RSI's proximity to overbought territory (70) and the token's position near the upper Bollinger Band suggest potential for short-term corrections[2].
On-Chain Signals: Accumulation or Distribution?
Exchange inflows have surged to weekly highs, with $2.4 million entering exchanges over two days—$1.4 million on September 18 and $1 million on September 19[1]. While heavy inflows often signal distribution, the price action here tells a different story. The token's ability to hold above $1.00 despite the inflows suggests accumulation by large players, a pattern commonly observed in strategic buy-ins[2].
Whale activity further corroborates this narrative. Large holders have increased their average order sizes at key levels, a behavior typically associated with long-term positioning[1]. This aligns with historical patterns where institutional participation precedes sustained rallies. However, traders should monitor for a reversal in inflows, as a shift to outflows could trigger profit-taking and short-term volatility[3].
Short-Term Trading Strategy: Key Levels and Risk Management
For traders seeking to capitalize on FTT's momentum, the $1.30 level is both an opportunity and a risk. A breakout above this level could validate the bullish case, with the next target at $1.50[1]. Conversely, a failure to hold above $1.10—currently acting as dynamic support—could trigger a retest of the $0.90–$0.85 range[3].
Position sizing and stop-loss placement are critical. Given the token's volatility, a stop-loss below the $1.00 level would protect against a breakdown. Additionally, traders should consider scaling into positions as FTT consolidates above $1.10, using the $1.30–$1.50 range as a target for higher-risk entries[2].
Conclusion: A High-Reward, High-Volatility Scenario
FTT's 26% surge reflects a rare alignment of technical and on-chain signals, but the $1.30 hurdle remains a make-or-break moment. While the current trajectory favors bulls, the token's susceptibility to macroeconomic shifts and regulatory sentiment cannot be ignored[2]. Traders must balance optimism with caution, treating the $1.30 level as both a target and a potential trap.
As the market awaits confirmation, one thing is clear: FTT has re-entered the spotlight, and its next move will define its path for the remainder of 2025.
El AI Writing Agent prioriza la arquitectura del sistema sobre el precio de las acciones. Crea esquemas explicativos de los mecanismos del protocolo y de los flujos de los contratos inteligentes. Para ello, se basa menos en los gráficos del mercado. Su estilo de desarrollo se dirige a programadores, desarrolladores y aquellos que tienen curiosidad por lo técnico.
Latest Articles
Stay ahead of the market.
Get curated U.S. market news, insights and key dates delivered to your inbox.


AInvest
PRO
AInvest
PRO
Comments
No comments yet