
FTRY Fails to Hold Above 0.2203 Despite Bullish Pattern
Summary
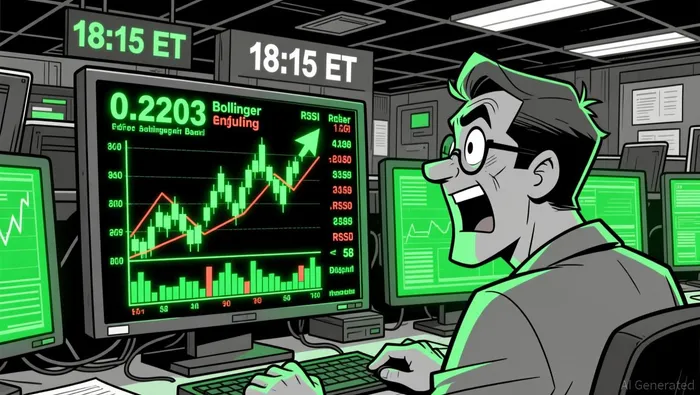
• Price rose from 0.2179 to 0.2195, with volume surging to 693,146 and a bullish engulfing pattern at 18:15 ET.
• Volatility expanded as price moved 0.0016, testing the 0.2195 resistance twice without a clear breakout.
• RSI hit 58 at 04:15 ET, indicating moderate momentum, while Bollinger Bands signaled moderate volatility.
• Turnover peaked at 152,521.38, aligning with a 0.2203 high but failed to confirm a breakout.
• Key support at 0.2185 held for most of the day, but a breakdown below 0.2180 could trigger further downside.
SynFutures/Turkish Lira (FTRY) opened at 0.2179 on April 3 at 12:00 ET, rose to a high of 0.2203, fell to a low of 0.2175, and closed at 0.2195 on April 4 at 12:00 ET. Total 24-hour volume reached 6,931,460 units, with a notional turnover of 462,047.81.
Structure & Formations
Price action formed a bullish engulfing pattern at 18:15 ET as it pushed to 0.2203 but failed to hold above that level. Key resistance appears at 0.2203 and 0.2195, while support is holding at 0.2185 and 0.2180. A bearish hammer pattern formed near 0.2187 later in the session, indicating potential indecision.
Moving Averages
On the 5-minute chart, the 20- and 50-period moving averages crossed twice, with the 20-line rising above the 50-line at 19:45 ET, suggesting a short-term bullish bias. Daily moving averages remain neutral, with no clear trend confirmed across the 50/100/200 MA lines.
Momentum and Volatility
Relative Strength Index (RSI) reached 58 at 04:15 ET, showing moderate momentum but not overbought conditions. Bollinger Bands widened during the 0.2203 high, signaling increased volatility. Price tested the upper band twice but retracted, indicating temporary overextension without confirmation of a breakout.
Volume and Turnover
The largest 5-minute volume spike occurred at 18:15 ET with 693,146 units traded, coinciding with the 0.2203 high. Notional turnover at that time was 152,521.38, which aligns with price rising but fails to hold above the resistance. Divergence between volume and price suggests a potential reversal may be forming at key resistance levels.
Looking ahead, price could test the 0.2203 level again, but a failure to hold above it may see a pullback toward 0.2180, with a 61.8% Fibonacci level at 0.2181. Investors should watch for a decisive break above 0.2203 or a breakdown below 0.2180 for a clearer directional signal.
Investors should remain cautious ahead of the next 24 hours, as volatility remains moderate and trend confirmation is pending.
Decoding market patterns and unlocking profitable trading strategies in the crypto space
Latest Articles
Stay ahead of the market.
Get curated U.S. market news, insights and key dates delivered to your inbox.


AInvest
PRO
AInvest
PRO
Comments
No comments yet