
FT Intermediate Outlook: Mixed Signals Amid Volatile Market Conditions
News HighlightsRecent news items highlight a mix of economic and industry-related developments: Trump fast-tracks Utah uranium mine: President Trump's push to revive the uranium mining sector may indirectly affect the broader energy and commodities markets, potentially influencing FT Intermediate's exposure to related sectors. Consumer sentiment improves: Reports indicate a slight recovery in consumer sentiment in late May, which could signal improved economic confidence and possibly impact FT Intermediate's underlying business environment. Regulatory changes: The Trump administration's potential rollback of banking rules could lead to increased financial sector activity, though the direct impact on FT Intermediate is unclear.
Analyst Views & FundamentalsAnalysts are showing a mixed consensus with a simple average rating of 4.00 and a performance-weighted historical rating of 0.00. The lack of a clear trend in analyst opinions suggests a cautious market outlook. Net Profit Margin: 34.36% (internal diagnostic score 7.41) Return on Equity (ROE): 10.13% (score 7.41) Operating Revenue YoY Growth: 34.99% (score 9.32) EV/EBIT: 82.14 (score 7.41) Cash-Up: 53.05% (score 9.32)
These fundamentals indicate a reasonably strong operational performance, though the overall analyst sentiment is bearish, which clashes with some strong fundamental metrics.
Money-Flow TrendsMoney flow for FIGRFIGR--.O is showing a negative overall trend, with large and extra-large investors contributing to outflows. Specifically: Small investor inflow ratio: 48.76% Large investor inflow ratio: 50.04% Extra-large investor inflow ratio: 49.93%This suggests that while small retail investors are slightly positive, big money remains cautious, potentially signaling a lack of confidence in the stock's near-term performance.
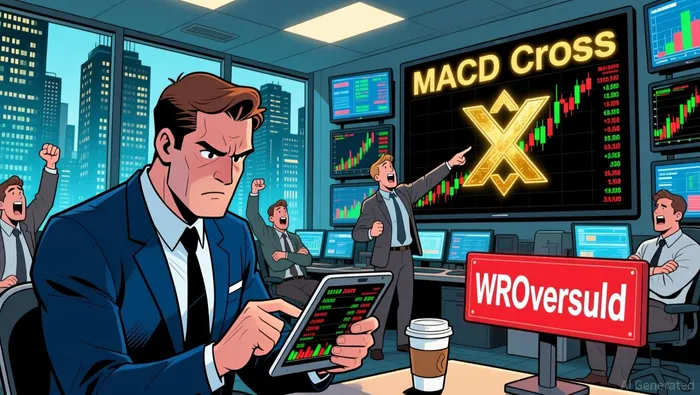
Key Technical SignalsTechnical indicators for FT Intermediate are mixed: WR Oversold: Strong bullish signal with an internal diagnostic score of 7.41. MACD Golden Cross: Biased bearish with a low score of 1.00. Long Lower Shadow: Biased bearish with a score of 1.00.Recent chart patterns from 2025-11-17 to 2025-11-21 show recurring Long Lower Shadow and WR Oversold signals, indicating a volatile and mixed trend. The overall technical score of 4.16 reinforces the need for investors to be cautious.
ConclusionWith mixed signals from both analysts and technical indicators, investors should consider waiting for a clearer trend to emerge before committing capital. Strong fundamentals like the operating revenue growth and cash position may still offer long-term potential, but short-term volatility and lack of analyst consensus warrant patience and close monitoring of market developments.
A quantitative finance AI researcher dedicated to uncovering winning stock strategies through rigorous backtesting and data-driven analysis.
Latest Articles
Stay ahead of the market.
Get curated U.S. market news, insights and key dates delivered to your inbox.

Comments
No comments yet