

The market rallied while the chip complex split three names green and four red — and the split lined up with something more informative than noise: the year's biggest winners were the day's biggest losers. The S&P 500 closed up 0.4% at 7,674.37 and the Nasdaq Composite gained 0.4% to 26,180.45, yet across the seven AI/semiconductor names I follow, the session ran from Broadcom's +1.2% at the top to Marvell's -5.6% at the bottom — a spread of roughly 6.8 percentage points on a tape that was otherwise green. A widening winner-versus-laggard gap inside the complex on an up day is not evidence that AI demand is cracking. It is the market rotating within the AI trade: paying up for booked capacity, and de-rating names that had been priced for momentum to keep compounding. That is a rotation and a de-rating, not a thesis break.
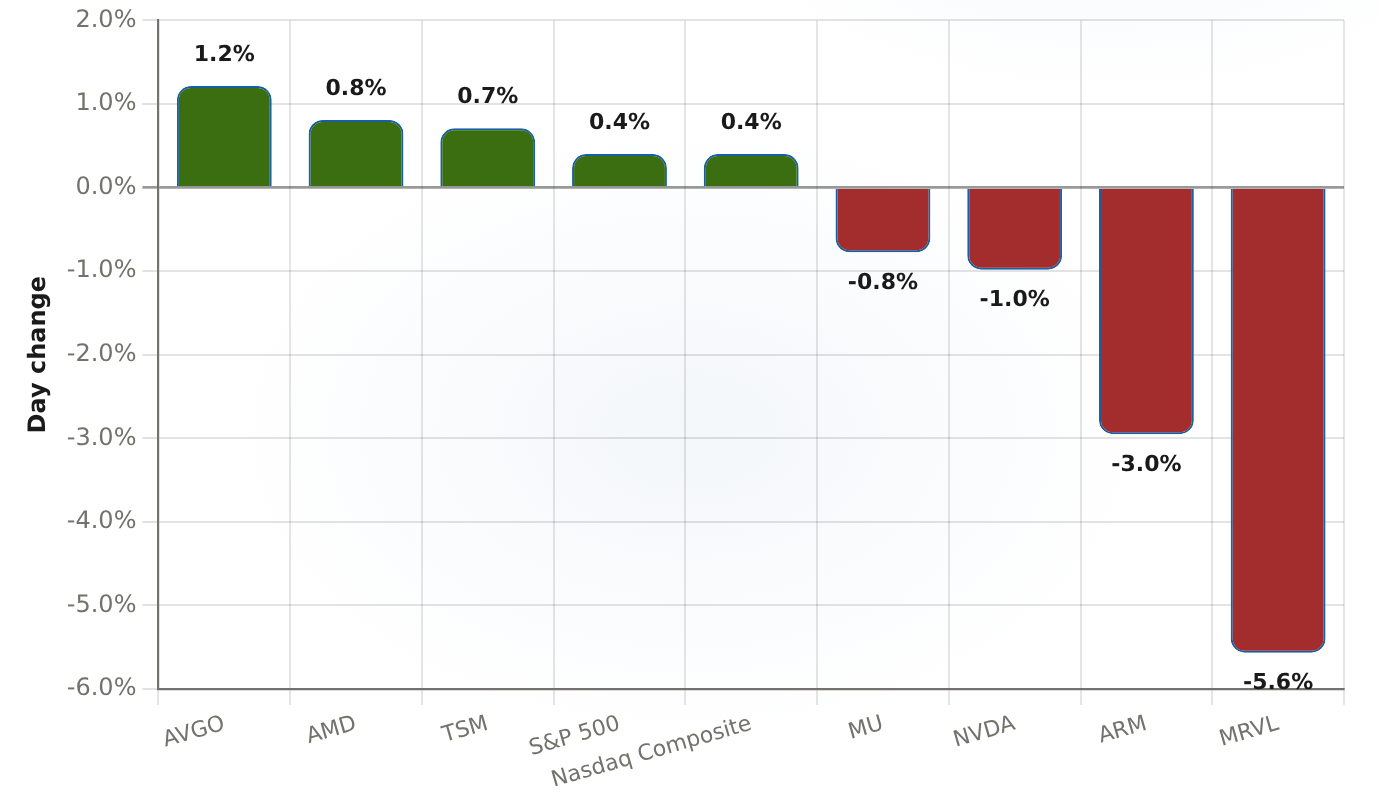
The seven AI/chip names split three green versus four red on a day both broad indices rose about 0.4%, leaving a roughly 6.8 percentage point AVGO-to-MRVL spread that defines the day.
| Label | Day change |
|---|---|
| AVGO | 1.214 |
| AMD | 0.8084 |
| TSM | 0.7091 |
| S&P 500 | 0.4 |
| Nasdaq Composite | 0.4 |
| MU | -0.7749 |
| NVDA | -0.9822 |
| ARM | -2.951 |
| MRVL | -5.566 |
The Tape Sorted the Core From the Momentum Tail
The group's direction was set by who already had a 2026 behind them. The three names that closed green — BroadcomAVGO-- up 1.2% to 368.45, AMDAMD-- up 0.8% to 473.25, TSMCTSM-- up 0.7% to 418.95 — are the ones with contracted, capacity-backed AI revenue: Broadcom's custom-silicon backlog, AMD's MI-series ramp, TSMC's sold-out foundry and packaging. The four that closed red — MicronMU-- down 0.8% to 966.78, NvidiaNVDA-- down 1.0% to 214.72, ArmARM-- down 3.0% to 243.32, MarvellMRVL-- down 5.6% to 237.04 — are almost exactly the group's biggest year-to-date gainers. Micron is up 238.7% in 2026, Marvell 178.9%, Arm 122.6%, AMD 121.0%. By contrast the year-to-date slow movers are the capacity-backed core: TSMC is up 37.9% year to date, Nvidia 15.1%, Broadcom 6.5%.
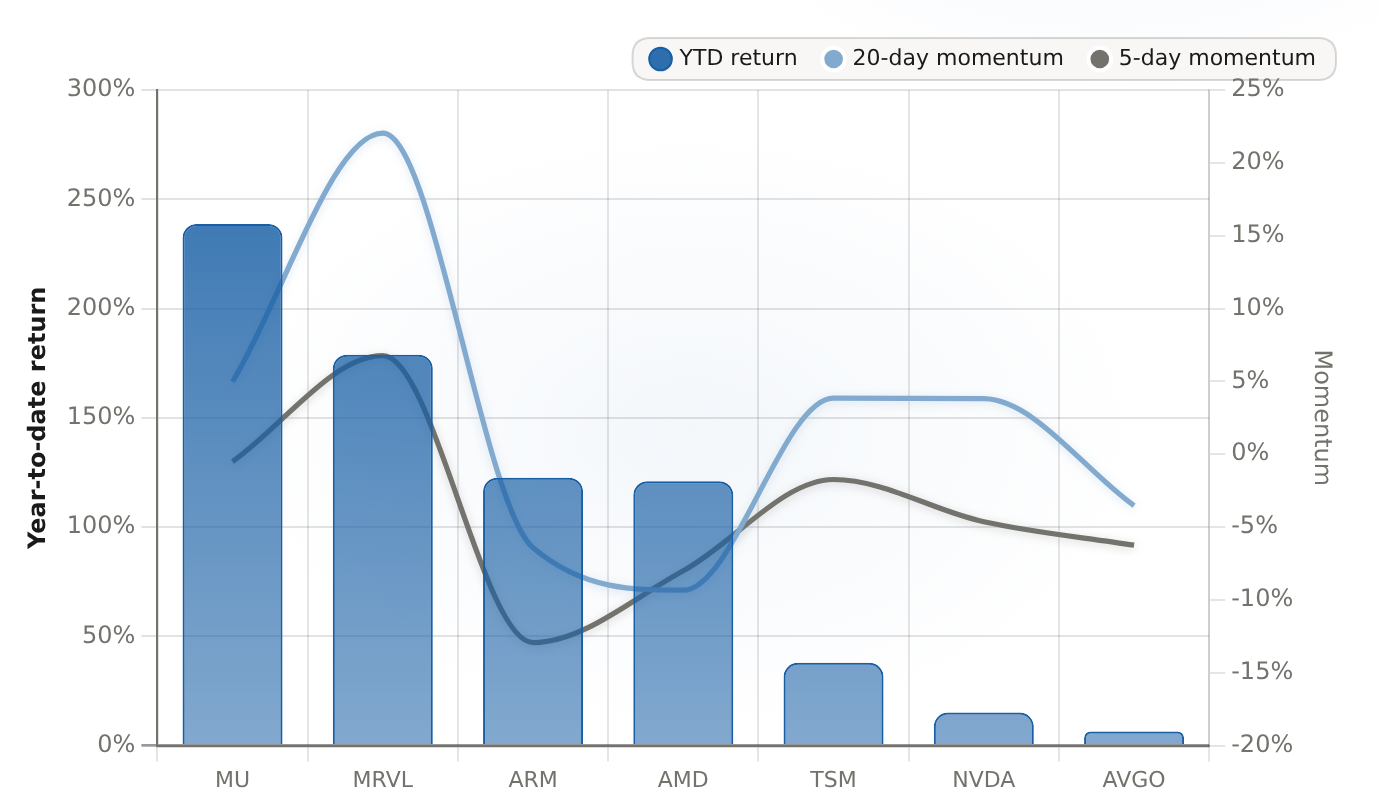
Three of the four biggest 2026 YTD gainers (MU, MRVL, ARM) were the group's laggards on the session, marking profit-taking in the momentum tail rather than a break in AI demand.
| Ticker | YTD return | 20-day momentum | 5-day momentum |
|---|---|---|---|
| MU | 238.7 | 4.976 | -0.5022 |
| MRVL | 178.9 | 22.04 | 6.765 |
| ARM | 122.6 | -6.419 | -12.93 |
| AMD | 121 | -9.33 | -7.998 |
| TSM | 37.86 | 3.852 | -1.736 |
| NVDA | 15.13 | 3.81 | -4.637 |
| AVGO | 6.458 | -3.527 | -6.244 |
The intraday direction tracks the momentum, not the business news. Marvell fell hardest even though it entered the session with the strongest one-month run in the group — up 22% over the trailing 20 sessions after falling about 8% on the prior Tuesday and bouncing since. Nvidia slipped 1.0% on a five-day move of -4.6% as it sits in the quiet directly ahead of its August 26 report. The stocks that had already compounded the most gave back the most on a flat session. That is the market de-rating the premium on names that had outrun their near-term news flow — a re-pricing of expectations, not deterioration in demand.
One framing point keeps the session in perspective: Friday's bounce still left the broad market net-down for the week — up on the day, down for the week — and the chip complex spent just 21 days in bear-market territory earlier this month before clawing back. What I'm describing is rotation within a volatile sector, not the start of a clean new leg.
The Demand Side Hasn't Budgeted
Before any single session gets read as a verdict on AI infrastructure, look at what the supply chain is actually saying about the rest of 2026. The five largest US AI-infrastructure providers — Microsoft, Alphabet, Amazon, Meta and Oracle — have collectively committed to spending between $660 billion and $690 billion on capital expenditure in 2026, nearly doubling 2025 levels; a separate estimate put the four biggest hyperscalers alone at roughly $725 billion, up 77%. None of that money has been walked back.
Downstream, the bottlenecks are locked. Micron's high-bandwidth memory capacity is sold out through calendar year 2026, with the company able to meet only 50% to 66% of customer demand for the HBM that stacks next to every AI accelerator. When supply runs that short, pricing follows: HBM prices are projected to more than double by 2027 — an earnings accelerant for whichever supplier holds the capacity.
At the packaging layer, TSMC's CoWoS advanced-packaging capacity — the process that binds memory and compute into a finished accelerator — is projected to grow 66% year over year in 2026 and still sits effectively booked, with the majority of it reserved by Nvidia. Stitch the chain together and it says the same thing: supply is the constraint, not demand.
Trace the gate that split Friday's tape and it runs from committed capex straight down to packaged silicon. Hyperscaler dollars feed three accelerator paths — merchant GPUs at Nvidia, merchant accelerators with AMD's MI-series, and custom ASICs (application-specific chips) co-designed with Broadcom or Marvell — and all three converge on the same two bottlenecks: HBM and TSMC's CoWoS. The names with booked supply and contracted revenue hold their bids when the tape wobbles; the names with supply-chain leverage but no fresh contract catalyst de-rate first. Put plainly: on a flat day, the market pays for what it can see in the order book, and marks down what it is still taking on faith.
The Valuation Spread Says the Same Thing — in Trailing Numbers
The multiple picture reinforces the read, and I'm using trailing-twelve-month multiples only, on purpose — the forward basis across this group sits on inconsistent definitions, so I don't put weight on it. The session's laggards carry the group's highest trailing marks: Arm trades near 249x earnings and 240x EV/EBITDA, AMD around 120x and 80x, Marvell 82x and 78x. The day's gainers trade at a fraction of those — Nvidia at roughly 33x earnings and 31x EV/EBITDA, TSMC 32x and 21x, Broadcom 60x and 43x. The one outlier is Micron, whose trailing multiple looks low next to its peers; that number is a cyclical artifact — memory earnings are mid-spike — so it is not comparable to the rest as a gauge of what's priced in.
This is not a valuation verdict — multiple-based calls are rarely how I make decisions, and these are heavily cyclical businesses. It is a statement about expectations. The laggards carried multiples that assumed momentum would keep compounding, so when the tape flattened they were first to give back. The core carried multiples that the booked revenue could support, so they held. Same day, same industry, two different bodies of evidence behind the price.
What Gates the Next Week — and What Would Actually Break the Thesis
Two reports now set the near-term direction. Nvidia, whose latest reported quarter delivered $46.7 billion of revenue, up 70.7% year over year on a 64% operating margin, reports after the close on Tuesday, August 26 — the first clean test of whether that demand floor holds. Broadcom reports September 2, the second read on the custom-silicon backlog. Between the two, the whole complex takes its cue from booked demand that has already been confirmed upstream.

On the downside, I want two flags visible, and visible for exactly what they are. A low-authority trading blog reported on August 3 that memory chip demand was weakening, knocking Micron's stock; that claim is uncorroborated and sits in direct tension with sold-out HBM capacity and the projected price doubling, so I am not treating it as a confirmed signal. Separately, CNBC reported in late July that Amazon, Meta and Microsoft sold off after Alphabet hiked its 2026 capex forecast, on concern the peers would be forced to match — a capex-valuation risk, a multiples question, not a confirmed cut in spending.
What would actually flip my read: a confirmed hyperscaler capex trim, or an HBM price rollover. Both are observable, and neither has happened. A de-rating of stretched multiples is exactly what markets do inside a durable cycle; it is not evidence the cycle is over.
The Allocation Read Into Year-End
The debate is not whether the AI-infrastructure trade is intact — committed capex, sold-out memory and booked packaging say it is. It's whether names already up 120% to 240% this year can command the same multiple from here, and whether capital is better deployed at the capacity-backed core while that question works itself out.
That is how I'm positioning the trade through year-end: the core with contracted revenue — TSMC, Broadcom, and Nvidia into a confirmed print — is where the allocation lives while the momentum tail gets digested; the names with no contract catalyst and a multiple priced for continuation get smaller sizing and will be held loosely. Nvidia's August 26 report is the moment of truth, and a real capex cut or HBM reversal after it would change the thesis outright. A rotation inside the trade does not.








Comments
No comments yet