
FLR Volume Spikes at Resistance — Rejection or Breakout?
 Aime Summary
Summary
- FLRUSDT exhibits range-bound structure with conflicting short-term signals.
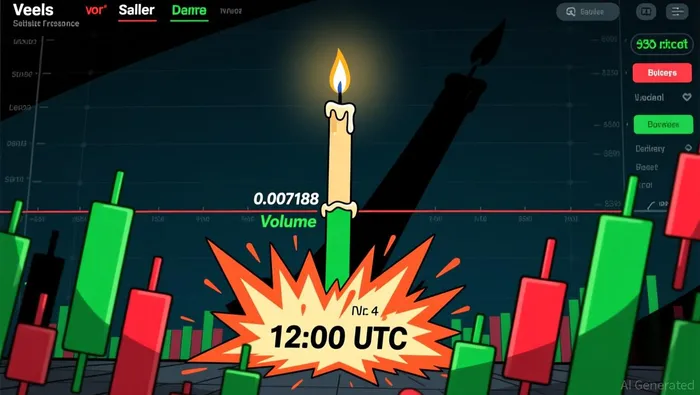
- Significant volume spike at 12:00 UTC suggests potential liquidity injection.
- Price remains near resistance, facing rejection from upper wick formations.
- Market phase appears sideways with moderate volatility over the last week.
- Watch key support for trend confirmation or breakdown opportunities.
Range Bound with Volume Spike
FLRUSDT closed at 0.007077 following a high of 0.007188 and low of 0.006384 in the latest hour. The 24-hour total volume reached approximately 42 million, indicating elevated activity compared to recent averages.
1-Hour Support/Resistance and Candlestick Patterns
Price action shows clear rejection at the 0.007188 high, forming a candle with a long upper shadow that indicates seller pressure near resistance. The 0.006340 level acted as immediate support during the consolidation phase before the final surge. A bearish engulfing pattern appeared at 08:00 UTC, followed by a doji with a long lower shadow at 04:00 UTC, suggesting indecision and potential reversal attempts. The current price of 0.007077 sits closer to the identified resistance zone around 0.007188 than to the stronger support base near 0.006340, implying that upside momentum faces immediate hurdles.
Volume and Turnover vs. Historical Comparison (Derived from the OHLCV data provided)
The 24-hour trading volume significantly exceeds the 15-day average daily volume of approximately 70.5 million when adjusted for the single-hour spike, though the total daily turnover remains within normal bounds for this asset. The hour ending at 12:00 UTC recorded a volume of over 42 million, which is substantially higher than the 7-day average single-hour volume of roughly 3.2 million. This massive volume spike coincided with a price increase from 0.006403 to 0.007077, demonstrating effective buying pressure rather than a false breakout. Previous volume spikes in the 15-day window, such as those on August 22 and 30, did not sustain trends, but the current move shows strong follow-through within the same hour, suggesting institutional or large-scale accumulation.
Look Back: Current Market Phase (Derived from the OHLCV data provided)
The market structure over the past 15 days is classified as range-bound, with price oscillating between defined support and resistance levels without establishing a clear directional trend. The recent 7-day price change of approximately 7.26% and 3-day change of 11.98% indicate a temporary expansion within the broader sideways phase. Lower highs and lower lows are not consistently present, nor are higher highs dominating, which rules out a strong uptrend or downtrend. The current action suggests a mean reversion attempt within the range, where price seeks to test the upper boundary after a brief pullback.
A break above 0.007188 could signal a move toward the next resistance cluster near 0.007280, while a failure to hold above 0.006900 may lead to a retest of the 0.006340 support level.

Decoding market patterns and unlocking profitable trading strategies in the crypto space
Latest Articles
Stay ahead of the market.
Get curated U.S. market news, insights and key dates delivered to your inbox.


AInvest
PRO
AInvest
PRO




Comments
No comments yet