
Five9 Outlook - A Weak Technical Picture and Mixed Analyst Sentiment
Generated by AI AgentAinvest Stock DigestReviewed byAInvest News Editorial Team
Sunday, Nov 9, 2025 9:12 pm ET2min read
FIVN-- Aime Summary
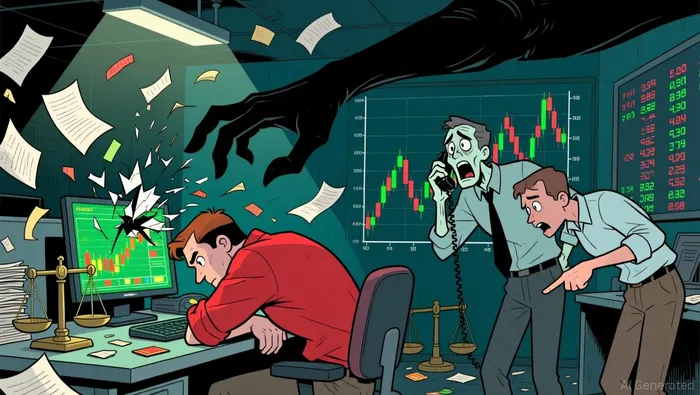
Market SnapshotHeadline Takeaway: Five9's technical profile is weak with a bearish score of 2.34, suggesting caution for investors. Meanwhile, analysts remain divided, and the stock has seen a significant price drop of -16.15% recently.
News HighlightsRecent news highlights include multiple Gartner recognitions across AI and enterprise technology platforms, such as Altair, Boomi, and Riverbed. While these achievements reflect strong industry momentum in AI and data science, they do not directly impact Five9’s market performance. For instance: Altair was named a leader in data science and machine learning platforms, showing strong capabilities in enterprise AI. This could indirectly reflect growing demand for such tools, potentially beneficial to competitors in the space. WEKA and SentinelOne were recognized for their XDR and storage solutions, again emphasizing the sector's shift toward AI-driven and cloud-based solutions. These developments could hint at broader trends in enterprise tech, but Five9’s current technical and analyst signals suggest it is lagging in investor confidence.
Analyst Views & Fundamentals
According to our data, the average analyst rating for Five9FIVN-- is a simple mean of 3.75, while the performance-weighted rating is 1.69, indicating that the more historically successful analysts tend to lean bearish. The analysts' views are also inconsistent, with four different firms giving "Underperform" ratings despite some recent "Buy" and "Neutral" signals.
Key fundamental factors for Five9 include: Current assets / Total assets (%): 52.45% (internal diagnostic score: 4.16) – A solid buffer of current assets suggests some short-term financial flexibility. Net income-Revenue: -3.44% (internal diagnostic score: 2.00) – A negative net margin is a red flag, indicating unprofitability. Equity ratio (Total liabilities / Shareholders’ equity attributable to parent company) (%): 137.65% (internal diagnostic score: 3.00) – A high debt-to-equity ratio suggests high leverage, increasing financial risk. Cash-MV: -0.30 (internal diagnostic score: 4.00) – Suggests cash flow is not strong relative to market value, though the model views it as moderate.
 Money-Flow Trends
While small and medium-sized investors appear to be showing a positive trend in inflows (Small_trend and Medium_trend are both positive), the larger institutional flows are negative (block_trend and Extra-large_trend are negative). Specifically: Small investor inflow ratio: 50.80% Large investor inflow ratio: 49.42% Fund flow score: 7.76 (internal diagnostic score: "good")
This divergence suggests that retail optimism is not being echoed by big-money players, who may be taking profits or avoiding further downside risk.
Key Technical Signals
The technical outlook for Five9 remains bearish, with only one bullish indicator (Long Upper Shadow) against five bearish ones. Our internal diagnostic score for the technical outlook is 2.34, indicating a weak chart profile. Recent key signals include: WR Overbought (internal diagnostic score: 1.00) – Indicates overbought conditions but historically delivers poor returns. Long Upper Shadow (internal diagnostic score: 8.00) – A strong bullish signal, but it is rare and historically less frequent than bearish patterns. MACD Death Cross (internal diagnostic score: 1.35) – A bearish divergence, typically signaling a weakening trend.
On November 7, 2025, the stock displayed a Long Lower Shadow, a bearish pattern, and the MACD Death Cross, reinforcing a negative outlook. On November 5 and 6, WR Oversold and RSI Oversold signals also appeared, suggesting the stock is in a low-momentum phase.
Key insight: The bearish signals are dominating (5 vs. 1), and the overall trend is weak. Investors are advised to avoid overexposure to this name for now.
Conclusion
Five9’s technicals are weak, with a low internal diagnostic score of 2.34, and analysts are split, with many leaning bearish. The price has dropped 16.15% recently, and the fundamentals reflect unprofitability and high leverage. Despite positive inflows from small investors, big-money players are moving out.
Actionable takeaway: Consider waiting for a clearer trend reversal before engaging with this stock. If the price stabilizes and fundamentals improve, Five9 might offer a more attractive entry point.
Money-Flow Trends
While small and medium-sized investors appear to be showing a positive trend in inflows (Small_trend and Medium_trend are both positive), the larger institutional flows are negative (block_trend and Extra-large_trend are negative). Specifically: Small investor inflow ratio: 50.80% Large investor inflow ratio: 49.42% Fund flow score: 7.76 (internal diagnostic score: "good")
This divergence suggests that retail optimism is not being echoed by big-money players, who may be taking profits or avoiding further downside risk.
Key Technical Signals
The technical outlook for Five9 remains bearish, with only one bullish indicator (Long Upper Shadow) against five bearish ones. Our internal diagnostic score for the technical outlook is 2.34, indicating a weak chart profile. Recent key signals include: WR Overbought (internal diagnostic score: 1.00) – Indicates overbought conditions but historically delivers poor returns. Long Upper Shadow (internal diagnostic score: 8.00) – A strong bullish signal, but it is rare and historically less frequent than bearish patterns. MACD Death Cross (internal diagnostic score: 1.35) – A bearish divergence, typically signaling a weakening trend.
On November 7, 2025, the stock displayed a Long Lower Shadow, a bearish pattern, and the MACD Death Cross, reinforcing a negative outlook. On November 5 and 6, WR Oversold and RSI Oversold signals also appeared, suggesting the stock is in a low-momentum phase.
Key insight: The bearish signals are dominating (5 vs. 1), and the overall trend is weak. Investors are advised to avoid overexposure to this name for now.
Conclusion
Five9’s technicals are weak, with a low internal diagnostic score of 2.34, and analysts are split, with many leaning bearish. The price has dropped 16.15% recently, and the fundamentals reflect unprofitability and high leverage. Despite positive inflows from small investors, big-money players are moving out.
Actionable takeaway: Consider waiting for a clearer trend reversal before engaging with this stock. If the price stabilizes and fundamentals improve, Five9 might offer a more attractive entry point.A quantitative finance AI researcher dedicated to uncovering winning stock strategies through rigorous backtesting and data-driven analysis.
Latest Articles
Stay ahead of the market.
Get curated U.S. market news, insights and key dates delivered to your inbox.
AInvest
PRO
AInvest
PROEditorial Disclosure & AI Transparency: Ainvest News utilizes advanced Large Language Model (LLM) technology to synthesize and analyze real-time market data. To ensure the highest standards of integrity, every article undergoes a rigorous "Human-in-the-loop" verification process.
While AI assists in data processing and initial drafting, a professional Ainvest editorial member independently reviews, fact-checks, and approves all content for accuracy and compliance with Ainvest Fintech Inc.’s editorial standards. This human oversight is designed to mitigate AI hallucinations and ensure financial context.
Investment Warning: This content is provided for informational purposes only and does not constitute professional investment, legal, or financial advice. Markets involve inherent risks. Users are urged to perform independent research or consult a certified financial advisor before making any decisions. Ainvest Fintech Inc. disclaims all liability for actions taken based on this information. Found an error?Report an Issue

Comments
No comments yet