
Fiserv Plunges 3.45% Amid Q2 Earnings Miss and Downbeat Outlook: Can the Payments Giant Stabilize?
 Aime Summary
Summary
• FiservFISV-- (FISV) closed at $52.245, down 3.45% following a disappointing Q2 2026 earnings report.
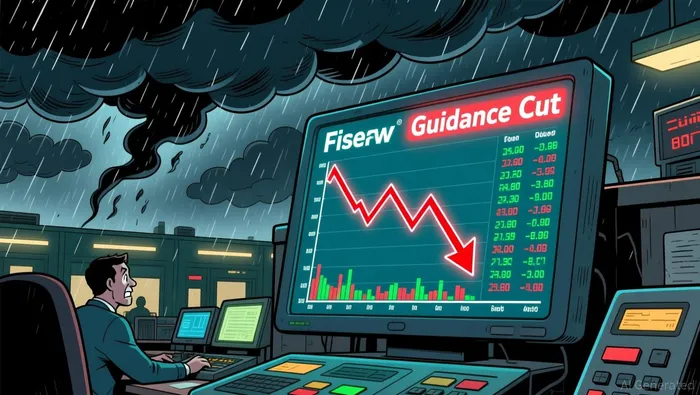
• The company slashed its 2026 adjusted EPS forecast to $7.20–$7.40, missing prior expectations of $8.00–$8.30.

• Organic revenue declined 5% in Q2, with Financial Solutions segment dropping 8% year-over-year.
• Activist investor Jana Partners is intensifying pressure on the board to review the strategic portfolio.
Fiserv’s stock faced a brutal session today, opening at $49.60 and rallying intraday to a high of $52.605 before settling near $52.245. The volatility was driven by a dual blow: a miss on non-GAAP earnings per share and a significant downgrade in full-year guidance. The market’s reaction underscores deepening concerns over the company’s growth trajectory amidst macro headwinds and strategic missteps.
Guidance Cut and Segment Weakness Trigger Sell-Off
The primary catalyst for Fiserv’s intraday decline was the company’s decision to lower its full-year adjusted earnings per share outlook to $7.20–$7.40, a substantial drop from the previous range of $8.00–$8.30. Management also revised organic revenue growth expectations for 2026 to a range of -1% to 0%, signaling potential stagnation rather than the previously anticipated 1–3% growth. Q2 results reflected this sluggishness, with GAAP revenue falling 4% to $5.29 billion and adjusted EPS coming in at $1.84, below analyst estimates of $1.92. The Financial Solutions segment, a key growth engine, saw an 8% decline in organic revenue, while Merchant Solutions dipped 1%. Additionally, activist investor Jana Partners has publicly urged a strategic review of the company’s portfolio and board composition, adding a layer of governance uncertainty to the financial disappointment.
Financial Data & Data Processing Sector Under Pressure
The broader Financial Data & Data Processing sector is currently navigating a challenging environment, with peer Automatic Data Processing (ADP) showing relative stability despite sector-wide headwinds. While ADP recently reported earnings that beat consensus estimates and maintains a strong institutional ownership base of 80.03%, Fiserv’s divergence highlights the specific operational struggles within its payment processing and banking solutions divisions. The sector leader, Visa (V), saw a modest intraday decline of 0.47%, suggesting that the pain at Fiserv is idiosyncratic rather than a broad-based sector collapse, though the entire group remains sensitive to interest rate fluctuations and transaction volume trends.
Technical Bounce or Falling Knife? Options Strategy for Volatility
Technical indicators present a mixed but cautiously bullish short-term setup amidst the downtrend. Key technical stats include:
• MACD: 0.88, Signal Line: 0.45, Histogram: 0.43 (Bullish crossover indicating momentum shift)
• RSI: 58.1 (Neutral, approaching overbought territory)
• 30-Day Moving Average: 51.49 (Price above, providing support)
• Bollinger Bands: Upper 56.12, Middle 52.17, Lower 48.22 (Price consolidating near middle band)
Despite the heavy earnings blow, Fiserv has reclaimed its 30-day moving average of $51.49 and is trading just above the Bollinger Band middle at $52.17. The MACD histogram turning positive at 0.43 suggests short-term bullish momentum is attempting to establish itself after the sharp decline. For traders looking to capitalize on this potential stabilization or continued volatility, the options chain offers high-leverage opportunities. We identify two contracts that balance high gamma and theta with manageable delta and attractive implied volatility.
• FISV20260814C53FISV20260814C53--: Call Option, Strike $53, Expiration 2026-08-14. IV: 45.61%, Leverage: 41.92x, Delta: 0.46, Theta: -0.20, Gamma: 0.11, Turnover: $19,069.
- Delta: Sensitivity to stock price (0.46 means $0.46 move per $1 stock change).
- Theta: Time decay cost per day (-0.20 indicates significant daily erosion).
- Gamma: Rate of delta change (0.11 shows high responsiveness to price swings).
- Turnover: Trading volume liquidity ($19,069 indicates active interest).
This contract stands out for its high gamma of 0.11, making it highly sensitive to upward price movements. With a delta of 0.46, it offers substantial upside potential if Fiserv bounces from current levels. The turnover of nearly $19k ensures liquidity for entry and exit. Under a 5% downside scenario (Target $49.63), the payoff would be zero, but in a bounce above $53, leverage amplifies gains.
• FISV20260814C57FISV20260814C57--: Call Option, Strike $57, Expiration 2026-08-14. IV: 49.49%, Leverage: 169.03x, Delta: 0.15, Theta: -0.09, Gamma: 0.06, Turnover: $24,507.
- Delta: Sensitivity to stock price (0.15 indicates low direct correlation, high optionality).
- Theta: Time decay cost per day (-0.09 is moderate decay).
- Gamma: Rate of delta change (0.06 shows good responsiveness).
- Turnover: Trading volume liquidity ($24,507 indicates highest volume in chain).
This contract offers extreme leverage of 169x with the highest turnover in the chain, making it ideal for speculative bets on a sharp recovery. While the delta is low, the gamma of 0.06 allows delta to expand quickly if the stock rallies. The IV of 49.49% is reasonable for the volatility expected. In a 5% downside scenario, payoff is zero, but a surge past $57 would yield massive returns due to the leverage ratio.
If Fiserv breaks below $50.50 support, bearish sentiment may accelerate. Aggressive bulls may consider FISV20260814C53 into a bounce above $53 to capture the MACD momentum.
Wait for Confirmation: Volatility Remains High
Fiserv’s move today reflects a market punishing both operational underperformance and strategic uncertainty. While short-term technicals show a potential bounce with the MACD turning positive and price holding above the 30-day MA, the fundamental damage from the guidance cut is significant. Investors should remain cautious and watch for a sustained break above $54 to confirm a reversal. The sector leader, Visa (V), saw a minor decline of 0.47%, indicating that broader financial tech sentiment is not entirely collapsed, but Fiserv must prove it can regain growth momentum. Watch for $50.50 breakdown or a successful defense of the 30-day moving average as key signals for near-term direction.

TickerSnipe provides professional intraday stock analysis using technical tools to help you understand market trends and seize short-term trading opportunities.
Latest Articles
Stay ahead of the market.
Get curated U.S. market news, insights and key dates delivered to your inbox.


AInvest
PRO
AInvest
PRO




Comments
No comments yet