
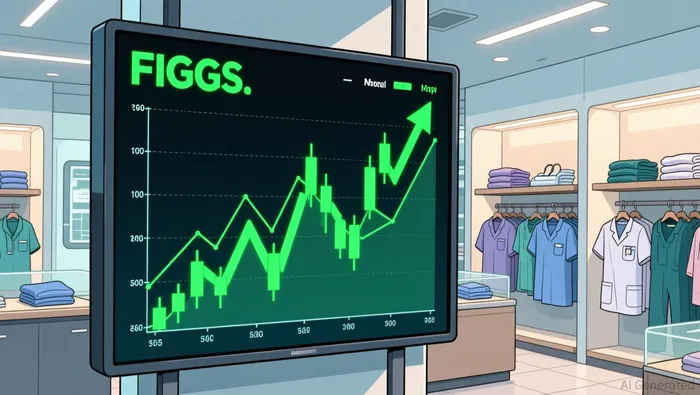
FIGS Explodes 26.87%: The Surgical Apparel Powerhouse Shatters Resistance in a Volume-Fueled Surge
 Aime Summary
Summary
• FIGSFIGS-- (FIGS) surged 26.87% intraday, closing at $14.26 after opening at $15.21
• The stock traded between an intraday low of $14.13 and a high of $16.38, testing its 52-week high of $17.48
• Turnover reached 6.42 million shares with a turnover rate of 4.23%, signaling intense institutional and retail interest
• Dynamic PE Ratio stands at 34.17, reflecting premium valuation amidst the momentum

The surgical apparel giant FIGS delivered a blockbuster performance today, breaking through key technical barriers with a forceful rally that left the broader market in its wake. Despite an initial gap-up open near $15.21, the stock absorbed selling pressure to hold firm, ultimately settling at $14.26—a massive gain from yesterday’s close of $11.24. This move represents a significant breakout from its long-term ranging structure, capturing the attention of traders seeking high-beta exposure in the consumer discretionary sector.
Technical Breakout and Sentiment Shift Drive FIGS Rally
The primary catalyst for this explosive 26.87% move is a definitive technical breakout combined with a shift in market sentiment towards the apparel sector. The stock has decisively moved above its 100-day and 200-day moving averages, which previously acted as heavy resistance. The MACD histogram has flipped strongly positive at 0.1957, indicating a powerful bullish momentum crossover. Furthermore, the RSI at 64.13 suggests strong upward pressure without yet entering overbought territory, leaving room for further upside. The surge is not driven by specific company news but rather by a broader technical re-rating, where the stock is catching up to its fundamental potential after a period of consolidation.
Apparel Sector Divergence: FIGS Outpaces Sector Leader UAA
While the broader Apparel, Accessories & Luxury Goods sector remains mixed, FIGS stands out as a clear outlier. The sector leader, Under Armour (UAA), is currently down 2.17%, highlighting a stark divergence in performance. This decoupling suggests that FIGS is benefiting from specific technical factors and perhaps a rotation into mid-cap apparel stocks that have been undervalued relative to larger peers. The sector news from Vogue Business highlights trends in sustainability and independent brands, which aligns with FIGS' brand positioning, but the immediate price action is driven by technicals rather than broad sector news.
Momentum Play: Technical Breakout and High-Leverage Options Strategy
The technical setup for FIGS is overwhelmingly bullish in the short term. Investors should note the following key indicators:
• 200-day MA: $11.84 (bullish support below)
• 100-day MA: $12.58 (breakout confirmed)
• RSI: 64.13 (strong momentum, not overbought)
• MACD Histogram: 0.1957 (positive divergence)
• Bollinger Bands: Price is well above the upper band of $11.28, indicating extreme strength
This technical strength is further validated by the options chain, which shows significant interest in near-term calls. The stock has broken above the 30-day resistance zone of $9.90–$9.95 and is now challenging the 52-week high of $17.48. With no valid leveraged ETFs available, options provide the most efficient leverage for this move. We identify two top options contracts based on high gamma, reasonable IV, and strong liquidity:
• FIGS20260821C12.5FIGS20260821C12.5--: Call, Strike $12.5, Exp 2026-08-21. IV: 30.00%, Leverage: 5.37%, Delta: 0.986, Theta: -0.039, Gamma: 0.040, Turnover: $232,594. This contract offers deep intrinsic value with high gamma, making it ideal for capturing immediate price movements. The high delta means it moves nearly 1:1 with the stock, while the gamma ensures accelerated gains as the price rises.
• FIGS20260821C15FIGS20260821C15--: Call, Strike $15, Exp 2026-08-21. IV: 73.48%, Leverage: 25.89%, Delta: 0.397, Theta: -0.043, Gamma: 0.182, Turnover: $6,228. This out-of-the-money call offers high leverage and significant gamma, providing substantial upside potential if the stock pushes towards its 52-week high. The high gamma indicates rapid sensitivity to price changes, amplifying returns in a volatile rally.
Options Payoff Calculation Primer: For this payoff estimation, we assume a 5% upside scenario from current price (14.26) where for Call Option Payoff = max(0, ST - K) where ST is projected price and K is strike price and Put Option Payoff = max(0, K - ST) where ST is projected price and K is strike price. This projection helps evaluate option contracts' potential returns under a continued bullish move scenario. For FIGS20260821C12.5, a 5% move to $14.97 yields a payoff of $2.47 per share. For FIGS20260821C15, the same move yields a payoff of $0.97 per share, but with higher leverage.
Aggressive bulls may consider FIGS20260821C15 into a bounce above $15.00, while conservative traders may prefer FIGS20260821C12.5 for lower risk and steady gains.
Hold the Line: Monitor $14.13 Support and $17.48 Resistance
The move in FIGS appears sustainable in the short term, driven by strong technical momentum and high volume. The key support level to watch is $14.13, the intraday low, which should hold as the new base for further gains. Resistance lies at the 52-week high of $17.48. Investors should monitor the RSI for any signs of overextension and watch for a break above $16.38, the intraday high, to confirm continued bullishness. While sector leader UAA is down 2.17%, FIGS' independent strength suggests it is leading a new wave of interest in the apparel sector. Watch for a break above $17.48 or a pullback to $14.13 to determine the next directional move.

TickerSnipe provides professional intraday stock analysis using technical tools to help you understand market trends and seize short-term trading opportunities.
Latest Articles
Stay ahead of the market.
Get curated U.S. market news, insights and key dates delivered to your inbox.


AInvest
PRO
AInvest
PRO




Comments
No comments yet