
Figma Stock Plunges 8.93% Amid Bearish Technical Signals
Generated by AI AgentAinvest Technical Radar
Monday, Aug 25, 2025 6:04 pm ET2min read
FIG-- Aime Summary
Figma (FIG) experienced a significant decline of 8.93% in its latest trading session, closing at $70.40 after establishing a daily range between $69.61 and $75.70. This sharp retreat highlights the heightened volatility characterizing the stock's recent performance and establishes the immediate context for our technical evaluation of the past month's price action.
Candlestick Theory
The recent price action reveals notable candlestick formations. The August 19th session formed a long-legged doji after an 8.86% decline, signaling indecision after a sharp drop. Subsequent days formed bearish engulfing patterns, particularly evident on August 25th, where the long red candle consumed the prior day's body. Key resistance now emerges at $77.30 (August 22nd high), with support at $69.61 (August 25th low). A breach below $69.61 could target the $67.00 swing low from August 20th, while recovery above $77.30 may signal short-term trend reversal potential.
Moving Average Theory
Using truncated periods due to limited data, the 5-day EMA ($73.02) crossed below the 10-day EMA ($75.98) on August 21st, triggering a bearish momentum signal. The current price trades substantially below both averages, confirming strong downside momentum. With the shorter moving averages accelerating downward and the price trading at a 14% discount to the 10-day average, the near-term trend remains decisively bearish, though stretched positioning suggests potential for technical rebounds.
MACD & KDJ Indicators
The MACD histogram shows deepening negative territory since August 18th, with both signal and MACD lines trending downward below the zero line. Concurrently, the KDJ oscillator maintains a bearish configuration with the K-line (28) and D-line (32) entrenched below the 50 midpoint. While not yet at oversold extremes, the KDJ's sustained downward trajectory since August 12th reinforces bearish momentum. No positive divergence is apparent, though a bullish crossover in oversold territory would warrant monitoring.
Bollinger Bands
Volatility expansion is evident as the bands widened from 4-point spreads to 6-point spreads during the late-August decline. Price currently hugs the lower band, last observed during the August 20th selloff. Historically, such lower-band proximity preceded technical rebounds (e.g., August 20th's rally from $67). However, the lack of immediate price rejection suggests possible continuation before stabilization. The BollingerBINI-- Band Width remains elevated, indicating persistent volatility risk.
Volume-Price Relationship
Distribution patterns dominate, with the three highest-volume sessions (August 4th, 6th, and 7th) occurring during breakdowns. Down days consistently show higher volume than up days, with the August 25th decline occurring on 62% above-average volume. Conversely, the August 20th rally saw weak volume confirmation. This volume asymmetry reinforces bearish sentiment, though capitulatory volume extremes near $70-$67 may indicate exhaustion if accompanied by reversal patterns.
Relative Strength Index (RSI)
The 14-day RSI reading of 36 sits near oversold territory but has not breached the critical 30 level. Notably, RSI failed to reach overbought levels during August recoveries, peaking at 58 on August 22nd before reversing. While not yet oversold, the indicator’s failure to sustain above 50 during relief rallies suggests underlying weakness. Traders should watch for bullish divergence should prices make new lows without corresponding RSI confirmations.
Fibonacci Retracement
Applying Fibonacci to the dominant downtrend from $142.92 (August 1st high) to $67.00 (August 20th low) reveals critical levels. The 23.6% retracement at $84.89 rejected prices on August 22nd, while the 38.2% level at $96.63 aligns with multiple prior resistance zones. Current price action below the 23.6% level reinforces bearish control. Should recovery materialize, the 38.2% retracement represents a formidable resistance confluence zone.
Confluence and Divergence Observations
Multiple indicators converge around the $67-$70 support zone, with Bollinger Band proximity, volume capitulation signals, and RSI nearing oversold territory aligning beneath key Fibonacci levels. The absence of bullish divergences across oscillators remains notable, with MACD, KDJ, and RSI all confirming new lows. However, the extreme August 4th gap down from $88.60 remains unfilled, creating a potential magnet for price recovery should sentiment improve. While near-term momentum favors bears, technical exhaustion signals are emerging at current levels, suggesting potential consolidation between $67 and $77.30 pending catalyst-driven directional resolution.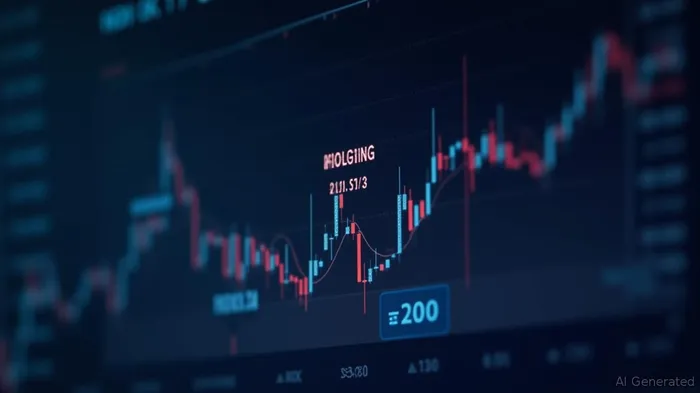
If I have seen further, it is by standing on the shoulders of giants.
Latest Articles
Stay ahead of the market.
Get curated U.S. market news, insights and key dates delivered to your inbox.
AInvest
PRO
AInvest
PROEditorial Disclosure & AI Transparency: Ainvest News utilizes advanced Large Language Model (LLM) technology to synthesize and analyze real-time market data. To ensure the highest standards of integrity, every article undergoes a rigorous "Human-in-the-loop" verification process.
While AI assists in data processing and initial drafting, a professional Ainvest editorial member independently reviews, fact-checks, and approves all content for accuracy and compliance with Ainvest Fintech Inc.’s editorial standards. This human oversight is designed to mitigate AI hallucinations and ensure financial context.
Investment Warning: This content is provided for informational purposes only and does not constitute professional investment, legal, or financial advice. Markets involve inherent risks. Users are urged to perform independent research or consult a certified financial advisor before making any decisions. Ainvest Fintech Inc. disclaims all liability for actions taken based on this information. Found an error?Report an Issue

Comments
No comments yet