
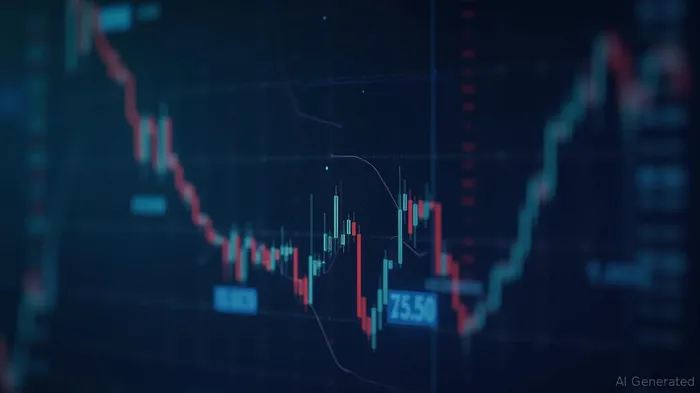
Figma Slides 4.10% To 76.16 As Bears Test Key 75.50 Support Level
Generated by AI AgentAinvest Technical Radar
Monday, Aug 18, 2025 6:05 pm ET2min read
Figma (FIG) declined 4.10% in the most recent session, closing at $76.16 amid sustained bearish pressure.
Candlestick Theory
Recent price action shows Figma testing the critical support level of $75.50 (August 18 low), which aligns with the 78.6% Fibonacci retracement level. The August 18 candlestick formed a small body with shadows, indicating indecision after a sharp decline, though not conclusively reversal-oriented. Resistance is evident near $81.00 (August 15 high) and $82.94 (August 14 high), where selling accelerated. A sustained break below $75.50 may trigger further downside, while reclaiming $81.00 could signal near-term stabilization.
Moving Average Theory
Figma trades below all key moving averages, confirming bearish momentum. The 5-day SMA (80.23) and 10-day SMA (80.94) slope downward, reinforcing short-term weakness. Price remains 6.3% below the 10-day SMA, reflecting persistent selling pressure. The longer-term 50/100/200-day averages (not fully calculable due to limited data but extrapolated as declining) further emphasize entrenched downtrend conditions, with no golden crosses or supportive convergences evident.
MACD & KDJ Indicators
The MACD histogram registers negative territory (-0.05), with the 5-day EMA (79.69) below the 10-day EMA (79.74), signaling bearish momentum. KDJ analysis (RSV-derived) shows the %K line near oversold territory but without bullish crossover confirmation. Neither oscillator currently flags divergence, though MACD’s sustained negativity aligns with ongoing distribution. Reversal potential remains unconfirmed pending upward MACD crossover or KDJ bullish convergence.
Bollinger Bands
Volatility remains elevated with bands diverging (10-day upper band: 89.84, lower band: 72.05). Price hugging the lower band (August 14 and 18) confirms bearish momentum, though the August 18 close above the band’s lower limit ($72.05) hints at tentative support. Contraction in band width may precede directional resolution; failure to rebound could see retesting of $72.05, while a hold may enable mean reversion toward the $80.94 midline.
Volume-Price Relationship
Recent distribution sessions (August 14: 8.13M shares, August 7: 14.15M shares) validated downside breaks. However, the August 18 decline occurred on reduced volume (4.24M vs. prior 4.68M), suggesting diminished selling urgency—a potential exhaustion signal. Low-volume rallies (e.g., August 15: +4.08% on 4.68M shares) lack conviction, indicating weak accumulation.
Relative Strength Index (RSI)
The 10-day RSI reads 39.6, hovering near oversold thresholds but avoiding a decisive sub-30 signal. This aligns with neutral-bearish momentum, lacking the extreme readings that historically preceded reversals. RSI divergence is absent; consistent lower lows match price action. Monitoring for oversold confirmation (RSI <30) with volume support is warranted to assess reversal potential.
Fibonacci Retracement
Applied to the $142.92 peak (August 1) and $75.50 trough (August 18), key retracement levels include: 23.6% ($91.41), 38.2% ($101.25), and 61.8% ($117.16). Current price sits near the swing low ($75.50), with $91.41 representing the first significant resistance hurdle. A rebound above $91.41 would suggest bearish exhaustion, but the deep retracement (67.4% drawdown) underscores dominant selling pressure. Confluence exists at $91.40–92.00, where the 23.6% Fib aligns with SMA resistance and prior consolidation.
Confluence and Divergence
Confluence reinforces $75.50 as critical support (Fibonacci swing low, Bollinger lower band proximity). No significant divergences exist among oscillators, with MACD, RSI, and KDJ uniformly echoing bearish momentum. The volume decrease at $75.50 and RSI’s approach to oversold may hint at weakening downside momentum, but reversal signals remain unconfirmed. Probabilistically, a consolidation phase near $75.50–81.00 appears likely before the next directional catalyst. Sustained trade below $75.50 may trigger accelerated declines, while a volume-backed break above $81.00 could enable relief rallies toward $91.41 resistance.
If I have seen further, it is by standing on the shoulders of giants.
Latest Articles
Stay ahead of the market.
Get curated U.S. market news, insights and key dates delivered to your inbox.


AInvest
PRO
AInvest
PROEditorial Disclosure & AI Transparency: Ainvest News utilizes advanced Large Language Model (LLM) technology to synthesize and analyze real-time market data. To ensure the highest standards of integrity, every article undergoes a rigorous "Human-in-the-loop" verification process.
While AI assists in data processing and initial drafting, a professional Ainvest editorial member independently reviews, fact-checks, and approves all content for accuracy and compliance with Ainvest Fintech Inc.’s editorial standards. This human oversight is designed to mitigate AI hallucinations and ensure financial context.
Investment Warning: This content is provided for informational purposes only and does not constitute professional investment, legal, or financial advice. Markets involve inherent risks. Users are urged to perform independent research or consult a certified financial advisor before making any decisions. Ainvest Fintech Inc. disclaims all liability for actions taken based on this information. Found an error?Report an Issue

Comments
No comments yet