
Freeport-McMoRan Plummets 6.66%: The Copper Tariff Storm That Shook the Market
 Aime Summary
Summary
• Freeport-McMoRanFCX-- (FCX) shares plummeted 6.66% intraday, closing near $71.15 amid severe copper price correction.

• Copper prices retreated from record highs of $14,875 per metric ton on the LME, triggering a broad sector sell-off.
• White House indecision on potential 15-30% copper tariffs has created massive uncertainty, causing buyers to pause.
• Technical indicators show RSI cooling to 63.98 and MACD histogram turning negative, signaling a shift from overheated to neutral momentum.
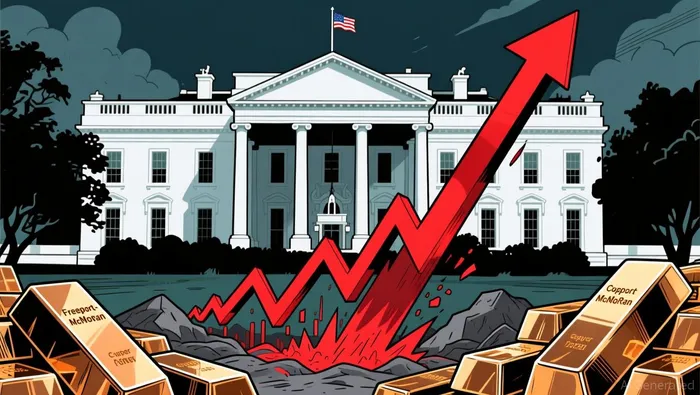
Freeport-McMoRan is currently navigating a turbulent intraday session, dropping sharply from its previous close of $76.23 to trade at $71.15. The stock’s steep decline mirrors the broader copper complex’s retreat from all-time highs, driven by a confluence of tariff ambiguity and profit-taking after a historic rally. With an intraday range spanning from $68.85 to $71.60, the volatility underscores the market’s sensitivity to policy signals.
Tariff Ambiguity and Copper Pullback Trigger Sell-Off
The primary catalyst for FCX’s sharp decline is the sudden reversal in copper prices, which fell 0.2% to $14,743 per metric ton after touching a record high of $14,875. This pullback follows five consecutive sessions of gains, fueled by tightening global inventories and a rush to stockpile metal ahead of potential U.S. tariffs. However, recent reports indicate that the White House remains split on imposing duties on refined copper, torn between inflationary risks for manufacturers and the goal of reshoring mining activity. This political indecision has frozen international trade flows, as producers hesitate to route metal abroad without clear tariff rules. Consequently, the speculative frenzy driving copper prices to record levels has cooled, leading to a rapid unwinding of long positions in both the metal and related equities like Freeport-McMoRan.
Copper Sector Woes: FCXFCX-- and Leader SCCO Dive Together
The sell-off in Freeport-McMoRan is not an isolated event but a sector-wide phenomenon. Sector leader Southern Copper (SCCO) mirrored FCX’s weakness, posting an intraday decline of 6.89%. This synchronized movement confirms that the pressure is macro-driven, stemming from copper fundamentals and policy uncertainty rather than company-specific issues. Both stocks are reacting to the same tailwinds of AI-driven demand and supply constraints being countered by tariff-induced market distortions.
Technical Breakdown and Strategic Options Plays for FCX
The technical landscape for Freeport-McMoRan is shifting from a strong uptrend to a consolidation phase. Key technical indicators reveal a stock that is cooling off after an extended run but has not yet broken its long-term bullish structure.
• 20-day Moving Average: $73.38 (Below current price, indicating short-term weakness)
• 50-day Moving Average: $67.17 (Above current price, providing mid-term support)
• RSI: 63.98 (Neutral, no longer overbought)
• MACD Histogram: -0.31 (Negative, signaling bearish momentum shift)
• Bollinger Lower Band: $64.46 (Major support zone)
FCX is currently trading below its 20-day average of $73.38 but holds above the critical 50-day line at $67.17. This pattern suggests the stock is catching its breath rather than entering a reversal. The RSI of 63.98 indicates that the overheated conditions from the summer climb have dissipated, leaving room for either a bounce or a gradual drift. Traders should watch $71.50 as immediate resistance where past bounces have failed, while a break below $67.17 could expose the stock to the 200-day moving average at $61.29.
Based on the provided options chain, we identify two high-potential contracts that balance leverage, liquidity, and sensitivity for this volatile environment. These selections are chosen for their high gamma (price sensitivity) and theta (time decay), offering significant leverage for short-term traders.
• FCX20260918C70FCX20260918C70-- (Call Option, Strike $70, Exp 2026-09-18): IV 50.86%, Leverage 23.77x, Delta 0.61, Theta -0.30, Gamma 0.07, Turnover $243k. This contract offers high liquidity and strong delta exposure, ideal for betting on a rebound. The high turnover ensures easy entry/exit.
• FCX20260918C71FCX20260918C71-- (Call Option, Strike $71, Exp 2026-09-18): IV 49.84%, Leverage 29.59x, Delta 0.54, Theta -0.28, Gamma 0.07, Turnover $71k. This at-the-money call provides a balanced risk-reward profile with high gamma, capturing rapid price swings. The moderate delta allows for significant upside if the stock stabilizes.
Options Payoff Calculation Primer: For this payoff estimation, we assume a 5% downside scenario from current price ($71.15) where for Call Option Payoff = max(0, ST - K) where ST is projected price and K is strike price and Put Option Payoff = max(0, K - ST) where ST is projected price and K is strike price. This projection helps evaluate option contracts' potential returns under a bearish move scenario. In a 5% drop to ~$67.59, the $70 Call would expire worthless, while the $71 Call would also lose value, highlighting the risk of holding calls in a downtrend. However, if the stock bounces 5% to ~$74.71, the $70 Call would yield a payoff of $4.71 per share, significantly outperforming the stock due to leverage.
If $73.38 breaks, FCX20260918C70 offers short-side potential via puts, while aggressive bulls may consider FCX20260918C71 into a bounce above $72.
Hold Firm or Cut Losses? Monitor $67.17 Support
The current move in Freeport-McMoRan appears to be a technical correction rather than a fundamental breakdown, but the risk remains elevated due to pending tariff decisions. Investors should monitor the 50-day moving average at $67.17 closely; holding above this level preserves the long-term bullish trend, while a breach could signal deeper trouble. Keep an eye on sector leader Southern Copper (SCCO), which is down 6.89%, as its movement will likely dictate the broader copper complex's direction. Watch for a sustained break below $67.17 or a decisive rebound above $73.38 to determine the next major trend.

TickerSnipe provides professional intraday stock analysis using technical tools to help you understand market trends and seize short-term trading opportunities.
Latest Articles
Stay ahead of the market.
Get curated U.S. market news, insights and key dates delivered to your inbox.


AInvest
PRO
AInvest
PRO




Comments
No comments yet