
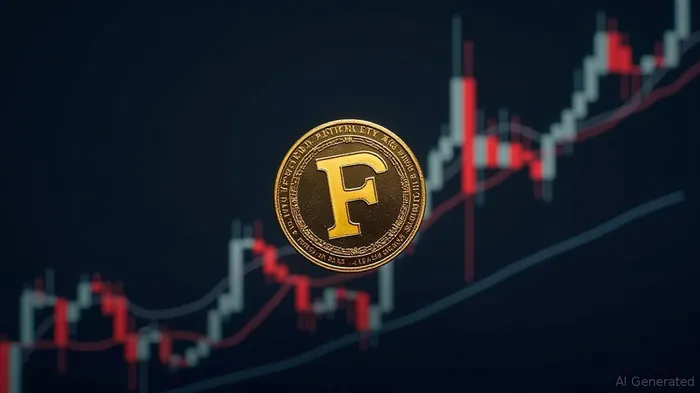
FARTCOIN Shows 25%–29% Upside Potential With Bullish Harmonic Pattern
FARTCOIN, a digital currency, has recently exhibited a key harmonicHLIT-- pattern that suggests a potential rebound in its value. This pattern, identified by analysts, indicates that the cryptocurrency may be poised for an upside move following a period of consolidation. The harmonic pattern, a technical analysis tool used to predict future price movements, has historically been a reliable indicator of market trends. According to the analysts' forecast, the completion of this pattern signals that FARTCOIN could be on the verge of a significant price increase.
The cryptocurrency market has recently been under pressure, facing a sharp pullback amid escalating geopolitical tensions. Ethereum (ETH) alone has dropped over 8% in the last three days, now trading near $2,530. As expected, this wave of volatility has rippled across altcoins and memecoins — including FARTCOIN. Currently down by over 2% on the day, FARTCOIN might appear to be struggling — but under the surface, a bullish technical signal could be emerging. A well-defined harmonic pattern forming on its short-term chart suggests a potential rebound could be brewing.
Zooming into the 1-hour timeframe, FARTCOIN is showing a classic Bearish Bat harmonic pattern — a setup known for forecasting bullish continuations until the pattern completes near the “Potential Reversal Zone” (PRZ). These PRZs are based on Fibonacci extensions, offering high-probability turning points in price action. In this case, FARTCOIN is currently started to finishing the CD leg of the pattern. If the structure plays out fully, the token could move toward the PRZ, located between $1.48 (0.886 Fib) and $1.53 (1.0 Fib). This suggests a potential 25%–29% upside from its current price before facing major resistance.
Such harmonic patterns don’t guarantee reversals, but they do offer strong predictive value — especially when paired with volume spikes or momentum shifts. The next few sessions will be critical. If FARTCOIN maintains its upward grind toward the $1.48–$1.53 range, it will validate the harmonic setup and could attract more attention from technical traders. However, once price reaches that PRZ, profit-taking or a short-term correction is likely — especially if broader market volatility persists. That said, the current structure favors more upside before such a reversal occurs.
Overall, FARTCOIN’s chart is showing early signs of a bullish rebound, backed by a textbook harmonic setup. While global tensions remain a wildcard that could override technical patterns, the short-term outlook looks promising — particularly for traders watching harmonic cues. The harmonic pattern observed in FARTCOIN's price chart is a complex structure that involves specific price levels and Fibonacci ratios. This pattern is often used by traders to identify potential reversal points in the market. The completion of the pattern suggests that the downward trend may be coming to an end, and a reversal to the upside could be imminent. This is a crucial development for investors who have been monitoring the cryptocurrency market, as it provides a potential opportunity for profit.
The potential upside move in FARTCOIN's value is not without risks, however. The cryptocurrency market is known for its volatility, and even the most reliable technical indicators can sometimes fail to predict market movements accurately. Investors should exercise caution and conduct thorough research before making any investment decisions. It is also important to note that the harmonic pattern is just one of many factors that can influence the price of a cryptocurrency. Other factors, such as market sentiment, regulatory developments, and technological advancements, can also play a significant role in determining the value of FARTCOIN.
In conclusion, the key harmonic pattern observed in FARTCOIN's price chart signals a potential upside move for the cryptocurrency. While this development is encouraging for investors, it is important to approach the market with caution and conduct thorough research before making any investment decisions. The cryptocurrency market is highly volatile, and even the most reliable technical indicators can sometimes fail to predict market movements accurately. Investors should stay informed about the latest developments in the market and be prepared to adjust their strategies accordingly.
Stay ahead of the market.
Get curated U.S. market news, insights and key dates delivered to your inbox.


Comments
No comments yet