
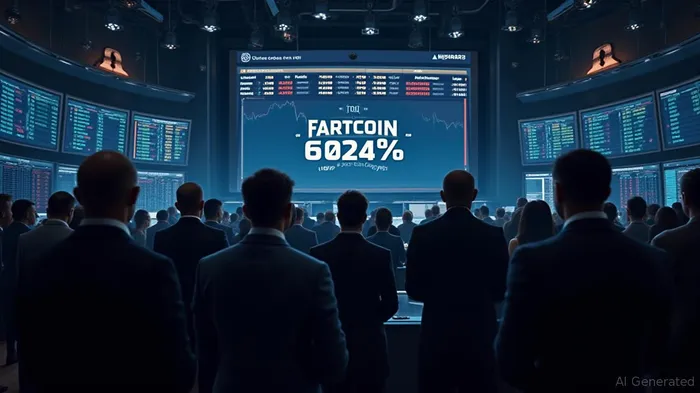
Fartcoin's Price Surges 631% in 70 Days Amid Solana ETF Hype
Fartcoin, a memecoin built on the Solana blockchain, has been attracting considerable attention from investors and analysts who are speculating about its potential for a breakout. The coin has experienced significant volatility, with recent price movements drawing comparisons to previous rallies. Some analysts suggest that Fartcoin's price action indicates a strong bullish trend, with the potential for another significant rally as the summer months approach. This optimism is driven by the anticipation of Solana ETFs, which could serve as a catalyst for broader meme coin breakouts.
The meme coin market has witnessed several explosive rallies this year, with Fartcoin emerging as one of the standout performers. The coin's recent price surge has positioned it as a top-five memecoin, with its market cap exploding to $1.5 billion. Analysts are now targeting a range of $2 to $3, indicating a bullish outlook for the coin. This sentiment is further supported by the institutional spotlight on Solana-based tokens, which are gaining legitimacy and attracting increased interest.
Fartcoin's recent price action has been marked by substantial volume, a key indicator of a potential breakout. A decisive break above certain resistance levels could trigger explosive moves, as seen in previous rallies. The coin's performance is also being closely watched in the context of the broader Solana ecosystem, where institutional interest and ETF momentum are fueling interest in meme coins with viral potential.
However, the potential for a breakout is not without risks. Historical data shows that meme coins often experience sharp corrections following significant rallies. If history repeats itself, Fartcoin could be in for another dip. This volatility is a characteristic feature of the meme coin market, where high-risk, high-reward plays are the norm. The coin's growth potential is seen as particularly high, especially if Layer 2 performance lives up to the hype.
Fartcoin did not see heavy demand during its rebound from $0.92 to $1.47. The lack of demand and the price action implied a range formation for the popular memecoin. Fartcoin was trending higher in April and May, but the bulls ran aground at the $1.5 resistance. Since then, a range formation has developed. With Bitcoin still above the $102.5k support and nearing its all-time high once again, the hopes of a FARTCOIN rally in the coming days may be warranted.
On the 1-week chart, the price flashed some bullish hints. The price action itself was uninspiring. After the strong rally in January, the price retraced all those gains to fall to the $0.21-low. From there, a 631% rally in 70 days, while impressive on paper, meant that the 50% retracement level remained an unbroken resistance level. The previous week also saw a rejection at the $1.47-level – The resistance since May. On the other hand, the psychological round number support at $1 stood strong during a retest in early June. The OBV also made a higher high, compared to earlier this year. Together, these factors suggested long-term investors can remain hopeful of a turnaround.
Fartcoin’s daily chart outlined a buying opportunity. On the 1-day chart, the picture was less bearish. The rebound from the $0.4 lows resulted in an ascending channelCHRO-- pattern. The rejection at $1.47-$1.5 saw Fartcoin fall below this ascending channel and test the $0.92 zone. This opened up the possibility of a range formation, and underlined the $0.9 area as a demand zone. The recovery from the $0.92-low to the $11.47 range high was quick, but the trading volume was not very high. In turn, the lack of high buying volume saw the OBV meander around the highs it made in May. At the time of writing, the OBV had not decisively broken the local highs of the recent weeks and the memecoin had settled into a range formation. Therefore, traders should continue to use the range extremes for their trading setups. An OBV breakout could presage a price breakout. At press time, the RSI bounced from the neutral 50-level as the price defended the mid-range support at $1.2. Swing traders can look for buying opportunities targeting the $1.4-$1.5 supply zone.
Stay ahead of the market.
Get curated U.S. market news, insights and key dates delivered to your inbox.

AInvest
PRO
AInvest
PRO
Comments
No comments yet