
Falcon Finance Spikes 10x in Volume, But Sellers Step In
 Aime Summary
Summary
- Falcon Finance trades in a tight range, currently testing immediate resistance zones.
- A massive volume spike at 10:00 UTC drove a sharp intraday price surge.
- Price action shows rejection wicks, suggesting strong selling pressure at higher levels.
- Market structure remains sideways with no clear directional trend over the past week.
- Traders should watch for follow-through volume to confirm any breakout attempts.
Intraday Volatility Spike
Falcon Finance (FFUSDT) closed the latest 1-hour candle at 0.06556, reflecting significant intraday volatility. The asset recorded a 24-hour total volume of approximately 2.76 million, indicating heightened activity compared to recent averages.
1-Hour Support/Resistance and Candlestick Patterns
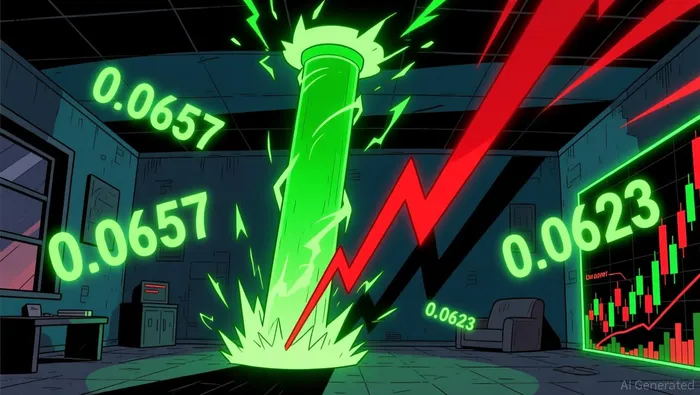
The market structure for FFUSDTFF-- is currently range bound, with price action oscillating between defined support and resistance levels. Immediate resistance is observed near 0.0657, a level where the price encountered rejection during the recent surge. Another key resistance zone exists around 0.0665, which has historically acted as a ceiling for upward moves. On the support side, the 0.0623 level has been tested multiple times, serving as a floor where buying interest emerges. The price is currently closer to resistance, having moved from the lower end of the range toward the upper boundary.
Candlestick analysis reveals specific rejection patterns. At 05:00 UTC on August 5, a candle with a long upper shadow formed, indicating that buyers pushed the price up but sellers forced it back down, a sign of distribution. This pattern aligns with the rule where the wick is significantly longer than the body, suggesting strong overhead supply. Additionally, a bullish engulfing pattern appeared at 07:00 UTC, followed by another at 10:00 UTC, which coincided with the major volume spike. However, the presence of long upper shadows on subsequent candles suggests that the upward momentum was not sustained, and sellers are actively defending higher price levels.
Volume and Turnover vs. Historical Comparison
To evaluate the significance of recent trading activity, we compare the current volume against historical baselines. The 7-day average single-hour volume is approximately 132,575. During the 24-hour period, the hour at 10:00 UTC on August 5 recorded a volume of 1,380,665. This figure is more than 10 times the 7-day average single-hour volume, constituting a massive volume anomaly.
Following this volume spike, the price moved from an open of 0.06253 to a close of 0.06556, a gain of approximately 4.8% in a single hour. This indicates that the volume was effective in driving the price upward initially. However, looking at the broader context, the volume at 01:00 UTC was also elevated at 209,554, yet the price declined. The massive volume at 10:00 UTC resulted in a sharp price increase, but the subsequent hours show mixed price action with upper shadows, suggesting that while volume drove the breakout, it may not have been accompanied by sustained buying pressure to hold the higher levels. The volume anomaly effectively drove the price, but the lack of follow-through in the immediate subsequent candles suggests caution.
Look Back: Current Market Phase
Analyzing the market phase over the last 7 to 15 days, FFUSDT exhibits a sideways market structure. The 15-day daily price range is narrow, at only 0.01, which is well within the 10% thresholdT-- for a ranging market. The 7-day price change is minimal at 0.17%, and the 3-day change is 1.72%, indicating a lack of strong directional momentum. The market structure feature is explicitly defined as range bound. There are no clear lower highs and lows indicative of a downtrend, nor higher highs and lows for an uptrend. The price action suggests that the asset is consolidating, with buyers and sellers in equilibrium. This sideways phase implies that breakouts are possible but require significant volume confirmation, as seen in the recent spike. Traders should expect continued volatility within the established range until a decisive break occurs.
Looking ahead to the next 24 hours, FFUSDT may continue to test the upper resistance levels if volume remains elevated. An upside risk exists if the price closes above 0.0657 with sustained buying pressure. Conversely, a downside risk emerges if the price fails to hold above 0.0623, which could lead to a retest of lower support levels around 0.0605.

Decoding market patterns and unlocking profitable trading strategies in the crypto space
Latest Articles
Stay ahead of the market.
Get curated U.S. market news, insights and key dates delivered to your inbox.


AInvest
PRO
AInvest
PRO




Comments
No comments yet