
Fair Isaac (FICO) Surges 4.56% on Earnings Momentum and Strategic Buybacks—Can the Rally Sustain?
Summary
• Fair IsaacFICO-- (FICO) rockets 4.56% intraday to $1,423.91, hitting a 52-week high of $1,436.12.
• Earnings beat of $8.57 EPS and a $1B stock buyback signal management confidence.
• Insiders sold 13,021 shares worth $22M, raising questions about alignment.
• Software sector peers like MicrosoftMSFT-- (MSFT) show modest gains, but FICO’s rally outpaces the sector.
Fair Isaac’s intraday surge reflects a mix of strong earnings performance and strategic capital allocation, yet insider sales and mixed technical signals create uncertainty. With the stock trading near its 52-week high, investors must weigh short-term momentum against broader market volatility and sector dynamics.
Earnings Beat and $1B Buyback Fuel FICO's Intraday Surge
Fair Isaac’s 4.56% rally is driven by a $8.57 EPS report, surpassing estimates by $0.82, and a $1B share repurchase plan, signaling management’s belief in undervaluation. The buyback authorization, allowing 2.3% of shares to be repurchased, underscores confidence in the stock’s long-term potential. However, insider sales by CEO William J. Lansing and CFO Steven P. Weber—reducing their holdings by 7.92% and 34.94%, respectively—introduce caution. The stock’s performance aligns with its 24% CAGR in EPS over three years, but the recent 3.4% point EBIT margin improvement and $1.36B revenue growth must sustain investor optimism.
Software Sector Gains Momentum as FICO Outperforms
The software sector, led by Microsoft’s 0.52% intraday gain, shows resilience amid AI-driven demand. Fair Isaac’s 4.56% surge far outpaces the sector’s average, reflecting its niche in credit modeling and decisioning technologies. Institutional investors, including Banco Bilbao Vizcaya Argentaria and Millennium Management, have increased stakes in FICOFICO--, contrasting with Microsoft’s more stable institutional ownership. While Microsoft’s growth is tied to cloud infrastructure, FICO’s rally hinges on its ability to leverage AI in financial services, a sector where recent innovations like Rivian-Volkswagen’s AI-driven software partnerships highlight emerging opportunities.
Technical Setup Points to Aggressive Longs with Caution on Overbought RSI
• 200-day MA: $1,868.28 (bearish divergence)
• RSI: 47.13 (neutral, but approaching overbought threshold)
• MACD: -64.74 (bearish signal), Signal Line: -78.44 (negative crossover)
• BollingerBINI-- Bands: Upper at $1,535.86 (near-term resistance), Middle at $1,385.83 (support)
Key levels to watch include the 200-day MA at $1,868.28 and the Bollinger Upper Band at $1,535.86. While the MACD histogram (-64.74) and WR overbought signal (3.54) suggest bearish pressure, the RSI’s 47.13 reading indicates potential for a rebound. The absence of leveraged ETF data complicates directional bets, but the stock’s 52-week high proximity demands caution. With no options data provided, traders should focus on tight stop-loss orders below the 200D MA and consider scaling into longs if the $1,385.83 support holds.
Backtest Fair Isaac Stock Performance
After a 5% intraday surge, FICO has historically shown positive short-to-medium-term gains. The backtest data reveals that the 3-day win rate is 56.42%, the 10-day win rate is 59.02%, and the 30-day win rate is 65.60%, indicating that FICO tends to experience gains in the immediate aftermath of such a surge. The maximum return observed was 6.74% over 30 days, suggesting that there is potential for significant price appreciation following the intraday increase.
Fair Isaac’s Rally Faces Crucial Test—Act Now or Miss the Window
Fair Isaac’s 4.56% surge hinges on its ability to sustain earnings momentum and validate the $1B buyback’s impact. While the stock’s 24% EPS CAGR and 3.4% EBIT margin improvement are bullish, insider sales and bearish technicals (MACD -64.74, WR overbought) create headwinds. Microsoft’s 0.52% gain in the software sector suggests broader optimism, but FICO’s rally requires a breakout above the 200D MA at $1,868.28 to confirm strength. Investors should monitor the 52-week high at $2,402.51 and consider longs if the $1,385.83 support holds, but brace for volatility as mixed fundamentals and technicals collide.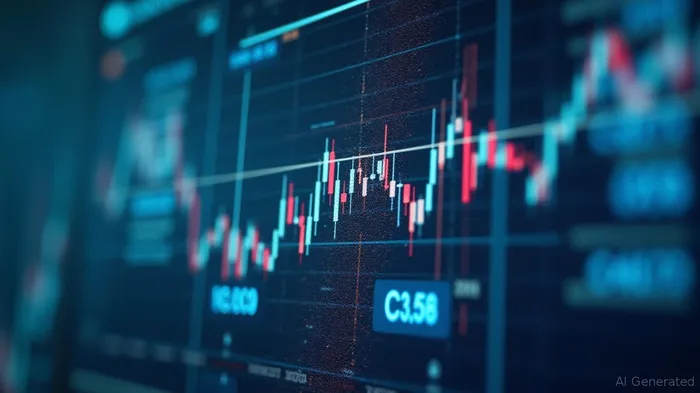
TickerSnipe provides professional intraday stock analysis using technical tools to help you understand market trends and seize short-term trading opportunities.
Latest Articles
Unlock Market-Moving Insights.
Subscribe to PRO Articles.
Already have an account? Sign in
Unlock Market-Moving Insights.
Subscribe to PRO Articles.
Already have an account? Sign in
Stay ahead of the market.
Get curated U.S. market news, insights and key dates delivered to your inbox.
AInvest
PRO
AInvest
PRO