
Exelixis (EXEL) Stumbles 2.7%: A Valuation Trap or a Golden Dip in Biotech?
 Aime Summary
Summary
• ExelixisEXEL-- (EXEL) shares retreated 2.72% intraday, closing near $55.155 after reporting Q2 earnings that beat consensus but failed to ignite momentum.

• The stock opened at a low of $51.76 before recovering to an intraday high of $55.435, signaling a volatile session with significant profit-taking.
• Despite the pullback, EXELEXEL-- trades at a dynamic P/E of 16.14, well below the peer average of 28.3x, suggesting underlying fundamental value.
• Short interest has surged 8.32% to 12.63% of float, indicating growing bearish sentiment among institutional traders.
Earnings Beat Ignites Profit-Taking and Short Interest Surge
Exelixis delivered a solid Q2 performance with adjusted earnings of $0.91 per share on $628.7 million in revenue, surpassing the FactSet consensus of $0.85 EPS and $636 million sales. However, the market reaction was decidedly cool, with the stock shedding 2.72% of its value. This divergence suggests that investors are treating the beat as a liquidity event to take profits after a 225.4% total return over the past five years. Compounding the selling pressure is a notable shift in sentiment: short interest has jumped 8.32% in the last month, with 12.63% of the float now sold short. The combination of a strong earnings report met with indifference, alongside a spike in short positioning, indicates that the market is currently focused on margin compression risks from 340B payer channels rather than top-line growth.
Biotech Sector Divergence: EXEL Slips While LLY Surges
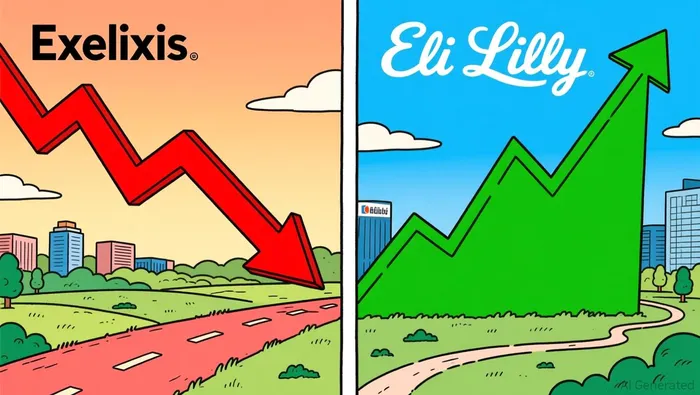
The broader pharmaceutical and biotechnology sector presents a mixed landscape, with sector leader Eli Lilly (LLY) demonstrating robust strength with an intraday gain of 1.92%. This divergence highlights a rotation within the healthcare sector, where large-cap growth stocks like LLY are capturing investor capital, while mid-cap oncology specialists like Exelixis face headwinds. While LLY benefits from high-growth GLP-1 narratives, EXEL is grappling with valuation scrutiny despite trading at a discount. The sector leader's momentum underscores the pressure on EXEL to prove its valuation gap can close, as investors increasingly favor companies with clearer, high-growth catalysts over value plays in a risk-off environment.
Technical Breakdown and High-Leverage Options Plays
The technical picture for Exelixis is mixed, balancing long-term bullish trends with short-term consolidation signals. Investors should monitor the following key technical indicators:
• 200-Day Moving Average: $46.03 (Support: Strong long-term floor)
• 30-Day Moving Average: $55.42 (Resistance: Immediate overhead supply)
• RSI (14): 53.96 (Neutral: Balanced momentum, no overbought/oversold signal)
• MACD Histogram: -0.128 (Bearish: Signal line crossing above MACD indicates weakening short-term momentum)
The stock is currently trading just below its 30-day moving average of $55.42, acting as immediate resistance. The negative MACD histogram suggests that short-term sellers are momentarily in control, though the RSI at 53.96 indicates the stock is not yet oversold. The 200-day MA at $46.03 remains a robust long-term support level, but near-term traders should watch for a decisive break above $55.43 to confirm a return to bullish momentum. No valid leveraged ETF data is available for direct sector hedging, so options strategies are preferred for directional exposure.
Based on the provided options chain, two contracts stand out for their high leverage, moderate delta, and favorable gamma/theta profiles:
• EXEL20260821C55EXEL20260821C55--: Call, Strike $55, Expiry 2026-08-21. IV: 43.27%, Leverage: 27.33%, Delta: 0.52, Theta: -0.139, Gamma: 0.080, Turnover: $1,967. This contract offers a balanced delta near 0.52, providing significant sensitivity to price moves with a high gamma of 0.080, meaning it will accelerate quickly if EXEL breaks above $55.43. The turnover of $1,967 ensures liquidity for entry and exit.
• EXEL20260918C60EXEL20260918C60--: Call, Strike $60, Expiry 2026-09-18. IV: 37.22%, Leverage: 46.96%, Delta: 0.28, Theta: -0.042, Gamma: 0.048, Turnover: $234. This out-of-the-money call offers higher leverage (46.96%) with a moderate IV of 37.22%. The lower theta decay compared to weekly options makes it suitable for a swing trade if EXEL reclaims its 52-week high of $57.57.
Options Payoff Calculation Primer: For this payoff estimation, we assume a 5% downside scenario from current price (55.155) where for Call Option Payoff = max(0, ST - K) where ST is projected price and K is strike price and Put Option Payoff = max(0, K - ST) where ST is projected price and K is strike price. This projection helps evaluate option contracts' potential returns under a bearish move scenario.
If $55.43 breaks, EXEL20260821C55 offers explosive upside potential with its high gamma.
Hold for Value, Watch for Breakout
The current pullback in Exelixis appears to be a valuation-driven correction rather than a fundamental breakdown. With a P/E of 16.14x against a peer average of 28.3x, the stock remains undervalued, but the surge in short interest and negative MACD signal caution for short-term traders. Investors should hold for the long-term value play but watch closely for a daily close above $55.43 to confirm the bulls are back in control. Meanwhile, sector leader Eli Lilly (LLY) is up 1.92%, highlighting the need for EXEL to show relative strength to regain capital inflows. Watch for $51.76 breakdown or a breakout above $55.43 to guide next moves.

TickerSnipe provides professional intraday stock analysis using technical tools to help you understand market trends and seize short-term trading opportunities.
Latest Articles
Stay ahead of the market.
Get curated U.S. market news, insights and key dates delivered to your inbox.


AInvest
PRO
AInvest
PRO




Comments
No comments yet