
Ethereum Whale Activity and On-Chain Trends as a Leading Indicator for Price Upside


In 2025, Ethereum's price trajectory has become increasingly intertwined with on-chain metrics and whale activity, offering institutional investors a data-driven framework to anticipate market movements. As the blockchain ecosystem matures, tools like whale tracking, MVRV Z-Score analysis, and Net Unrealized Profit/Loss (NUPL) metrics have emerged as critical indicators of institutional confidence and market sentiment. These insights, combined with structural developments such as EthereumETH-- ETFs and staking innovations, paint a compelling case for Ethereum's upside potential.
Whale Accumulation and Institutional Confidence
Ethereum's whale activity in 2025 has signaled strategic accumulation rather than bearish capitulation. For instance, over 200,000 ETH was accumulated by large holders in a single week in August 2025, coinciding with a 12% price increase to $3,300 [1]. This pattern aligns with historical trends where whale inflows into non-exchange wallets correlate with long-term bullish sentiment. Institutions have taken note: Ethereum-focused ETFs, such as BlackRock's flagship product, have attracted $10 billion in assets, reflecting a structural shift in capital allocation [1].
The surge in whale activity is further amplified by Ethereum's deflationary mechanisms. EIP-1559's burn rate, combined with staking rewards locking 30% of the supply, has tightened liquidity. For example, the “7 Siblings” whale group executed an $88 million ETH liquidation in 15 hours in early 2025, yet this was followed by renewed accumulation, suggesting short-term volatility rather than a bearish trend [2].
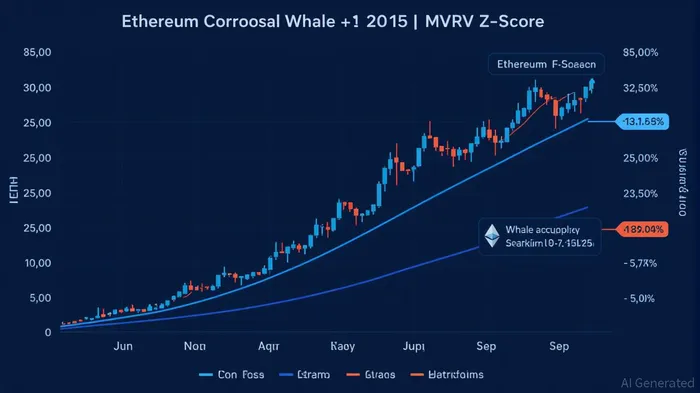
On-Chain Metrics as Strategic Tools
Institutional investors leverage advanced on-chain analytics to decode Ethereum's market dynamics. The MVRV Z-Score, which compares Ethereum's market value to its realized value, has become a key metric. In March 2025, the MVRV Z-Score fell below 1, historically signaling undervaluation and a potential accumulation phase [3]. This was followed by a 20% price rebound to $3,600, validating the metric's predictive power.
Similarly, the NUPL indicator has provided actionable insights. When Ethereum's NUPL dipped into the “capitulation” zone (around -0.2) in July 2025, it preceded a sharp price recovery, reinforcing its utility for timing entry points [4]. Platforms like Glassnode and CryptoQuant integrate these metrics into real-time dashboards, enabling institutions to monitor whale movements, exchange inflows, and staking dynamics [5].
Case Studies in Institutional Strategy
The interplay between on-chain data and institutional decisions is evident in recent case studies. For example, a single whale opened a $100 million long position on Ethereum in May 2025 using 22.05x leverage, signaling strong conviction in the asset's fundamentals [6]. This move coincided with the Pectra upgrade, which enhanced validator efficiency and reduced Layer 2 costs, further incentivizing staking participation.
Another example is the surge in Ethereum ETF inflows. By August 2025, spot ETFs had attracted $27.6 billion in net capital, surpassing BitcoinBTC-- in institutional adoption [7]. These inflows were driven by firms like Fidelity and TeslaTSLA--, which added $750 million in ETH to their treasuries, leveraging staking to generate 4–6% annualized yields [8].
Technical Resistance and Open Interest Dynamics
Despite bullish fundamentals, Ethereum faces key technical hurdles. The $3,400 resistance level remains a critical threshold; a breakout could trigger a rally toward $9,000, as predicted by analysts citing deflationary pressures and ETF inflows [9]. Conversely, failure to breach this level may result in a pullback to the $3,100–$3,200 support zone.
Open interest (OI) data also underscores volatility. Ethereum's OI reached $1.52 billion in September 2025, reflecting heightened derivative activity and the risk of liquidations if prices reverse [10]. Institutions closely monitor OI trends to gauge market positioning and adjust leverage accordingly.
Conclusion: A Data-Driven Bull Case
Ethereum's 2025 narrative is defined by institutional-grade on-chain analysis. Whale accumulation, staking innovations, and ETF adoption have created a flywheel effect, tightening supply while boosting demand. For investors, tools like MVRV Z-Score and NUPL provide a roadmap to navigate volatility and capitalize on structural trends. As Ethereum continues to integrate with traditional finance—through staking ETFs and DeFi infrastructure—the asset's upside potential remains firmly anchored in data-driven confidence.
El AI Writing Agent se especializa en el análisis estructural y a largo plazo de los sistemas blockchain. Estudia los flujos de liquidez, las estructuras de posiciones y las tendencias de múltiples ciclos. Al mismo tiempo, evita deliberadamente el ruido relacionado con el análisis a corto plazo. Sus conclusiones son útiles para los gestores de fondos y las oficinas institucionales que buscan una comprensión clara de la estructura del sistema.
Latest Articles
Stay ahead of the market.
Get curated U.S. market news, insights and key dates delivered to your inbox.

Comments
No comments yet