
Ethereum News Today: GRT Consolidates in Symmetrical Triangle Ahead of Potential Breakout
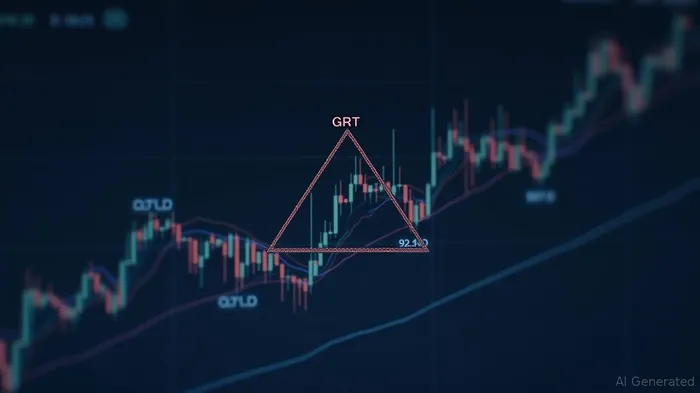
The Graph (GRT) is currently consolidating within a symmetrical triangle pattern, marked by a series of lower highs and higher lows. This structure, which signals balanced pressure from buyers and sellers, is narrowing as the price range continues to tighten, indicating an approaching breakout point [2]. Traders and analysts are closely monitoring the asset’s proximity to the upper trendline resistance. A confirmed breakout above this level—accompanied by a significant increase in volume—could trigger a bullish continuation and lead to a price rally [3].
Conversely, a breakdown below the lower support trendline would shift control to sellers, potentially leading to a short-term decline in price. Analysts from Alpha Crypto Signal highlight that both scenarios remain plausible, and the key to determining the market’s direction lies in observing volume spikes and candlestick patterns near the pattern’s boundaries [2]. Until the triangle breaks decisively, GRT is expected to oscillate between its support and resistance levels, waiting for a catalyst to push it out of consolidation [3].
The current technical setup for GRT aligns with broader patterns seen in other major cryptocurrencies. For example, EthereumETH-- recently broke out of a long-term resistance level, sparking institutional interest and bullish momentum. If GRT follows a similar trajectory, a significant price movement—either upward or downward—could unfold depending on how the triangle resolves [4]. This is further supported by the pattern’s historical reliability across various assets, including EIGEN and SHIBSHIB--, where similar formations have led to sharp price reactions once broken [5].
The broader market environment is also favorable for technical breakouts, with increased on-chain activity and institutional adoption of blockchain assets reinforcing liquidity and investor interest. Although GRT has not yet mirrored Ethereum’s dramatic price movement, its position within a tightening symmetrical triangle suggests it may benefit from similar momentum should the pattern resolve in favor of a bullish breakout [6].
Traders are advised to exercise caution and watch for confirmation signals before taking positions. A decisive move—whether up or down—would likely be followed by a wave of follow-through activity. Given the current stage of consolidation, the outcome of GRT’s upcoming breakout could play a pivotal role in shaping its short- to medium-term trajectory [7].
Source:
[1] https://www.ainvest.com/news/shib-approaching-key-breakout-zone-tightening-moving-averages-2508/
[2] https://www.tradingview.com/symbols/EIGENUSDT.P/ideas/
[3] https://www.tradingview.com/ideas/pennant/
[4] https://bravenewcoin.com/insights/ethereum-eth-price-prediction-ethereums-1-5-year-resistance-breakout-could-ignite-7000-surge
Comprende rápidamente la historia y el antecedente de diversas monedas conocidas
Latest Articles
Stay ahead of the market.
Get curated U.S. market news, insights and key dates delivered to your inbox.

AInvest
PRO
AInvest
PRO
Comments
No comments yet