
Ethereum Consolidates Near $1,926 As Institutional Accumulation Outpaces Fee Revenue
 Aime Summary
- Ethereum application layer fees reached $1.79 billion in Q2 2026, yet Layer 1 captured only 4.9% of that value in economic terms.
- Spot EtherENS-- ETFs recorded $244.94 million in weekly net inflows, marking the strongest institutional demand in nearly four months .
- The asset trades near $1,923, trapped beneath a stubborn technical resistance ceiling that has repelled multiple rally attempts this summer.
Ethereum is currently trading around $1,903, locked in a tight consolidation range following a slight 24-hour decline. Despite choppy price action, daily spot volume remains robust at $7.2 billion to $8.7 billion . This fragmented spot market, characterized by discrepancies across trading desks, is a hallmark of transitional accumulation zones . Heavy spot buying is necessary to clear the overhead supply blocks stacked above the current price .
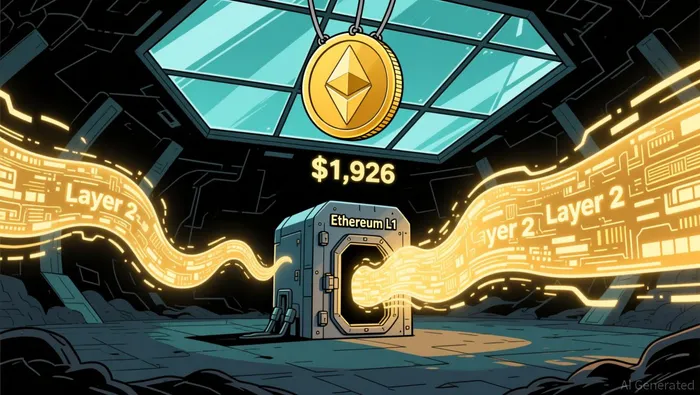
The primary driver of this market dynamic is a structural divergence between network activity and revenue capture . EthereumENS-- Layer 2 rollups processed 1,270 user operations per second compared to just 20.4 on the mainnet . Despite this scale, Layer 1 captured only $88.4 million in real economic value . This 4.9% capture rate explains Ethereum’s approximately 32% year-to-date drop compared to Bitcoin’s 11% decline .
The Dencun upgrade’s blob fee mechanism drastically reduced data posting costs for rollups . Consequently, the seven-day blob fee burn dropped to approximately 0.22 ETH . This is minimal against a 0.85% annual supply growth and a 2.6% staking yield . The deflationary pressure previously associated with high network congestion has effectively stalled .
Why Is Institutional Accumulation Rising Despite Low L1 Revenue?
Institutional appetite for Ethereum is revitalizing, evidenced by the recent surge in ETF inflows . Spot Ethereum ETFs absorbed $114.6 million in inflows over just two days . Cumulative inflows have now pushed to $11.46 billion . This indicates that large-scale capital is entering the market despite the ongoing fee revenue disconnect .
Corporate entities are also aggressively building positions. BitMine has accumulated over 5.8 million ETH valued at $11.3 billion . The company has staked 85% of its position and is closing in on a 5% total supply stake . On the on-chain front, major whales acquired 80,000 ETH valued at $152 million . Significant purchases from Coinbase Prime and Fidelity-associated wallets drove the Whale Sentiment Index above 60 .
Fundstrat’s Tom Lee highlighted that Ethereum outperformed the Nasdaq 100 by 2,500 basis points and BitcoinBTC-- by 1,100 basis points in July 2026 . This marked the largest monthly outperformance against the Nasdaq since July 2025 . Lee pointed to a historical pattern where Bitmine Immersion Technologies shares tend to outperform ETH in the subsequent two months following such events . With July marking the fourth instance, market attention is focused on whether this trend will persist into August and September .
Can Ethereum Break The $1,926 Resistance Ceiling?
Ethereum faces a stubborn resistance ceiling at $1,926 . This level has repelled three separate rally attempts this summer . The 100-day Exponential Moving Average at $1,926 remains the primary barrier to further upside . Only a monthly close above this level would reopen the path to $2,000 .
Technical analysis indicates a balanced fight between range buyers and overhead supply . On-chain metrics show strong order book density in the $1,713 to $1,740 zone . A break beneath this band would invalidate short-term bullish structures and expose lower macro liquidity levels . Support is identified at $1,880 .
To the upside, immediate resistance forms around $1,950, followed by structural overhead near $2,000 . If spot buyers absorb existing order book supply, an expansion toward $2,100 becomes the primary path of least resistance . Analysts note that monthly TD Sequential indicators have flashed buy signals . This metric has historically correlated with major trend reversals .
However, the asset's large market cap imposes a 57% ceiling for 2026 returns compared to smaller caps . Reaching $3,000 in 2026 represents a 57% appreciation . This ceiling contrasts with the higher asymmetric upside potential sought in smaller market cap projects .
The broader market environment remains complex. Bitcoin slipped below the $65,000 thresholdT-- as market participants weighed technical risks against institutional demand . Ether declined slightly by 0.07% to trade at $1,915.52, while SolanaSOL-- posted a gain of 1.98% . The divergence between institutional inflows and technical anxieties highlights a market where macro flows are currently outweighing micro-structural risks .
Regulatory developments may also influence price action. The U.S. Senate began voting on the CLARITY Act, which could provide regulatory clarity if passed . Analysts argue that Ethereum is transitioning from a fee-accruing asset to a reserve capital and settlement medium for institutional tokenized finance . With $299.4 billion in stablecoins and $17.2 billion in Real World Assets on-chain, demand may eventually shift toward ETH as collateral and settlement gas .
The market is currently pricing Ethereum in a margin-compression phase . Cheap execution was subsidized to build ecosystem scale, deferring economic returns to Layer 1 . Resolution depends on whether RWA and stablecoin volumes grow enough to outstrip blob supply . This would restore fee pressure and reactivate the burn mechanism . Until then, Ethereum remains trapped in a tight trading channel with significant liquidity waiting on either side .

Blending traditional trading wisdom with cutting-edge cryptocurrency insights.
Latest Articles
Stay ahead of the market.
Get curated U.S. market news, insights and key dates delivered to your inbox.


AInvest
PRO
AInvest
PRO




Comments
No comments yet