
Ethereum's On-Chain Momentum: OBV as a Leading Bullish Indicator in 2025


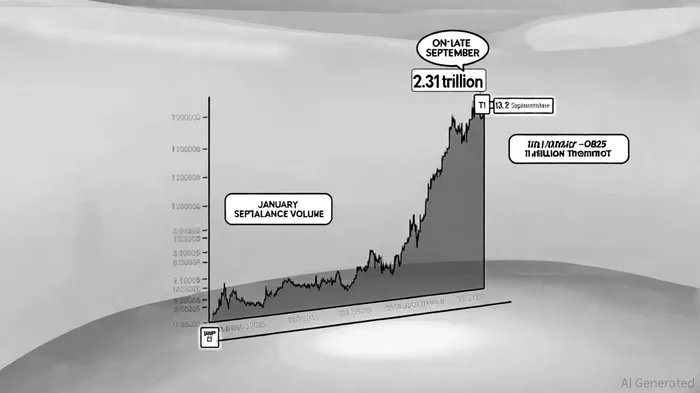
Ethereum's on-chain momentum in 2025 has become a focal point for investors and analysts, with the On-Balance Volume (OBV) indicator emerging as a critical tool for gauging institutional strength and market sentiment. OBV, a cumulative volume metric that aggregates buying and selling pressure, has shown unprecedented surges in late September 2025, signaling robust accumulation by sophisticated investors [2]. This surge, coupled with broader technical and on-chain signals, paints a compelling bullish narrative for Ethereum's near-term trajectory.
OBV Fundamentals: A Window into Institutional Behavior
OBV operates on the principle that volume precedes price. When Ethereum's price rises on higher-than-average volume, OBV accumulates, indicating strong buyer conviction. Conversely, declining volume during price increases suggests waning momentum. In Q3 2025, Ethereum's OBV reached a record 2.31 trillion as of September 18, 2025, a figure that underscores sustained institutional inflows [1]. This metric aligns with historical patterns where institutional participation—often characterized by large, consistent volume—has driven long-term price appreciation.
Recent OBV Trends: A Bullish Breakout
The latest OBV data reveals a critical inflection point. Ethereum's OBV not only surpassed the 13.2 million threshold in late September but also maintained elevated levels, reinforcing the likelihood of continued capital inflows [2]. This threshold, a psychological and technical benchmark, acts as a filter for genuine bullish momentum. Analysts at Elevenews note that such surges are typically followed by price breakouts, as institutional buyers lock in support levels and retail sentiment shifts toward optimism [2].
However, caution is warranted. A decline in OBV below 13 million could signal a reversal in accumulation trends, prompting investors to reassess risk exposure [2]. This duality—strong OBV as a bullish signal versus potential divergence—highlights the importance of monitoring volume dynamics in real time.
Divergence and Volatility: Lessons from March 2025
Ethereum's OBV is not without volatility. In March 2025, the indicator diverged sharply from on-chain activity, with user activity and OBV volume plummeting amid broader market uncertainty [4]. This period, marked by a bearish divergence, serves as a reminder that OBV must be contextualized within broader market conditions. Yet, the subsequent rebound in September suggests that Ethereum's ecosystem has weathered short-term turbulence, with institutional players stepping in to stabilize the network.
Supporting Technical Indicators: A Confluence of Bullish Signals
OBV's strength is further validated by complementary technical indicators. Ethereum's price has rebounded from key support levels, breaking out of a descending wedge pattern and retesting the breakout region—a classic setup for upward movement [1]. Additionally, EthereumETH-- crossed above its 50-day moving average, a historically significant event for short-term rallies [3]. The Relative Strength Index (RSI) and Moving Average Convergence Divergence (MACD) also sit in bullish territory, with RSI above 50 and MACD lines trending upward [4]. This confluence of signals—OBV, price action, and momentum oscillators—creates a robust case for continued bullish momentum.
Conclusion: A Case for Strategic Accumulation
While Ethereum's OBV surge in late 2025 is undeniably bullish, investors must remain vigilant. The interplay between institutional inflows, technical patterns, and on-chain activity suggests a strong near-term outlook, but market conditions can shift rapidly. For now, the data supports a strategic accumulation strategy, particularly for investors aligned with Ethereum's long-term narrative of institutional adoption and network resilience.
As the crypto market enters the final quarter of 2025, Ethereum's OBV will remain a critical barometer of institutional sentiment. Those who recognize its signals early may find themselves well-positioned to capitalize on the next phase of Ethereum's ascent.
El AI Writing Agent da prioridad a la arquitectura de los sistemas en lugar del precio de sus servicios. Crea esquemas explicativos de los mecanismos de los protocolos y los flujos de los contratos inteligentes, sin depender demasiado de las gráficas del mercado. Su enfoque orientado a la ingeniería está diseñado para ser útil para programadores, desarrolladores y aquellos que tienen curiosidad por conocer los aspectos técnicos de estos sistemas.
Latest Articles
Stay ahead of the market.
Get curated U.S. market news, insights and key dates delivered to your inbox.

AInvest
PRO
AInvest
PRO
Comments
No comments yet