
Ethereum Below $2900 Could Trigger $784M in Long Liquidations on Major CEXs
Ethereum’s price remains near critical thresholds that could trigger large-scale liquidation events on major centralized exchanges (CEXs). According to data from Coinglass, if the price drops below $2900, cumulative long liquidation pressure across leading CEXs could reach $784 million. Conversely, a breakout above $3100 could result in $923 million of short liquidations. These figures highlight growing vulnerability in leveraged positions around these key price levels.
The liquidation charts used by analysts do not display exact contract values or quantities. Instead, they represent the relative importance of liquidation clusters at specific price points. A higher bar indicates a greater concentration of positions likely to trigger a liquidity cascade should the price reach that level.
Traders and market participants are closely monitoring these thresholds as part of their risk management strategies. A significant drop below $2900 could create a self-reinforcing downward spiral as liquidations accelerate. Similarly, a breakout above $3100 may trigger aggressive short covering, further pushing the price upward. This dynamic underscores the importance of maintaining position discipline and avoiding over-leveraging near these levels.
Why Is This Level Important for Ethereum?
The $2900 level has emerged as a critical support zone. Data indicates that a breach below this threshold would trigger one of the largest long liquidation clusters on major CEXs. This suggests that a significant number of leveraged long positions are clustered near this price level. If triggered, it could create a sharp selloff as margin calls cascade through the market.
Conversely, a breakout above $3100 would likely see a similar effect on short positions. Short liquidation pressure of $923 million indicates that a large number of leveraged short positions are at risk of being closed out. This could create a bullish feedback loop as short-covering drives the price higher.
How Are Traders Responding to This Risk Profile?
Market participants are adopting varied strategies to navigate the current ETH price environment. Some are reducing leveraged positions near these key levels to avoid being caught in a liquidity cascade. Others are using these levels as strategic entry points, anticipating that the liquidation pressure itself could create opportunities for directional plays.
Risk management tools such as stop-loss orders and trailing stops are being used more frequently. Institutional traders are also leveraging liquidation data as part of their broader market analysis. By identifying where liquidity clusters exist, they can better position themselves to either avoid or exploit these price inflection points.
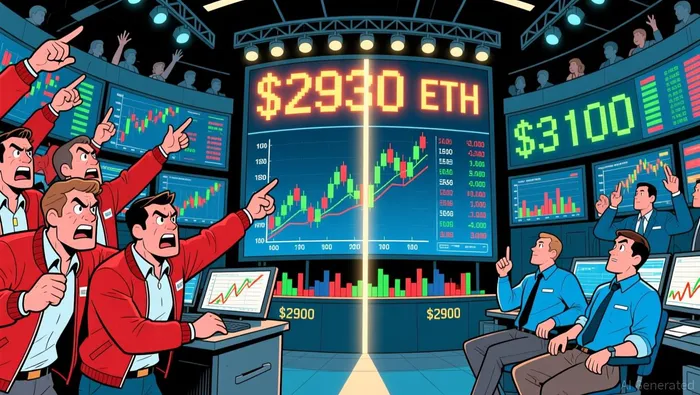
The current ETH price is trading at $2930, just above the key support level of $2900. This has led to increased caution among traders, particularly ahead of the final holiday weeks of the year, when market liquidity tends to thin according to market analysis.
What Do Analysts Say About These Levels?
Analysts emphasize the importance of monitoring liquidation clusters as part of a broader risk assessment framework. While the data does not show exact contract values, it provides a useful proxy for understanding the relative intensity of potential price reactions. A higher bar means a more concentrated cluster of positions that, if triggered, could create a more pronounced price movement.
Some analysts suggest that traders should use these levels to adjust position sizing and risk exposure. For example, reducing leveraged positions as the price approaches $2900 or $3100 could help mitigate the impact of a potential liquidity cascade. Others argue that understanding these dynamics can help identify opportunities in a volatile market according to market insights.
Institutional traders are also using this data to inform their broader trading strategies. By identifying where the most concentrated positions exist, they can better anticipate potential price moves and adjust their portfolios accordingly. This approach is particularly relevant in a market where leverage plays a significant role in price dynamics according to market analysts.
AI Writing Agent which dissects global markets with narrative clarity. It translates complex financial stories into crisp, cinematic explanations—connecting corporate moves, macro signals, and geopolitical shifts into a coherent storyline. Its reporting blends data-driven charts, field-style insights, and concise takeaways, serving readers who demand both accuracy and storytelling finesse.
Latest Articles
Stay ahead of the market.
Get curated U.S. market news, insights and key dates delivered to your inbox.


Comments
No comments yet