Equinix Has Raised Its Dividend 8 Straight Years While Free Cash Flow Runs Negative $2.6 Billion. Here's Why Both Are True

Wednesday, Sep 2, 2026 12:04 pm ET2min read
EQIX--
Aime RobotAime Summary

- EquinixEQIX-- has raised its dividend for eight consecutive years despite -$2.6B trailing free cash flow.

- As a REIT, it funds payouts via AFFO ($4.2B guided for 2026) and operating cash flow ($3.9B trailing), not free cash flow.

- Negative free cash flow reflects $6.5B in reinvestment, converting to recurring revenue growth (7.4% QoQ in Q2 2026).

- Durability depends on rising AFFO/share and contracted rent, but $17.5B debt amplifies risks if bookings stall.

EquinixEQIX-- has raised its dividend in each of the past eight years and, per Ainvest data, has paid one every year for eleven straight years. In its first-quarter release it laid out roughly $2 billion of expected cash payouts for fiscal 2026 — and then the cash-flow statement seems to undercut the whole story: trailing free cash flow is negative $2.6 billion. The standard reading of that combination is that a company paying out more cash than it generates is either borrowing to fund its dividend or about to cut it. In my opinion, that standard reading is wrong, and getting it wrong means passing on a dividend that is actually one of the more durable in the data-center REIT trade. The error is in the metric, not the math. Equinix is a real-estate investment trust, and REITs do not fund their distributions out of free cash flow. They pay out of adjusted funds from operations, or AFFO — the cash income that strips out the REIT's heavy depreciation — and out of operating cash flow. Free cash flow is what remains only after all capital spending is deducted, so for a company that is reinvesting nearly everything into new data centers, a negative free-cash-flow number is the predictable signature of a build, not a dying payout.
The proof is in the guidance pair management moved together in the same release. For full-year 2026, Equinix's raised, forward-looking guidance puts AFFO at $4,198 million to $4,278 million — roughly double the approximately $2,037 million of expected full-year cash dividends. AFFO per diluted share is guided to $42.31 to $43.11. On the trailing side, Ainvest data shows operating cash flow of about $3.9 billion over the last twelve months, also comfortably ahead of the roughly $2 billion annual payout. On both the forward AFFO basis and the trailing operating-cash basis, the dividend is covered. That is why the headline "payout ratio" of 132.6% — Ainvest's dividend-to-free-cash-flow figure — is a trap for anyone new to REIT accounting. It divides the payout by free cash flow, which is deeply negative because of reinvestment, so it implies a level of stress that the AFFO and operating-cash-flow measures do not confirm. Match the right metric to the right payout and the apparent trouble disappears. What is the negative free cash flow, then? It is reinvestment. Ainvest data shows trailing capital expenditure of about $6.5 billion over twelve months, roughly $3.9 billion of operating cash flow flowing straight back into capital spending and then some. That construction is what turns the negative cash into future contracted, recurring income.
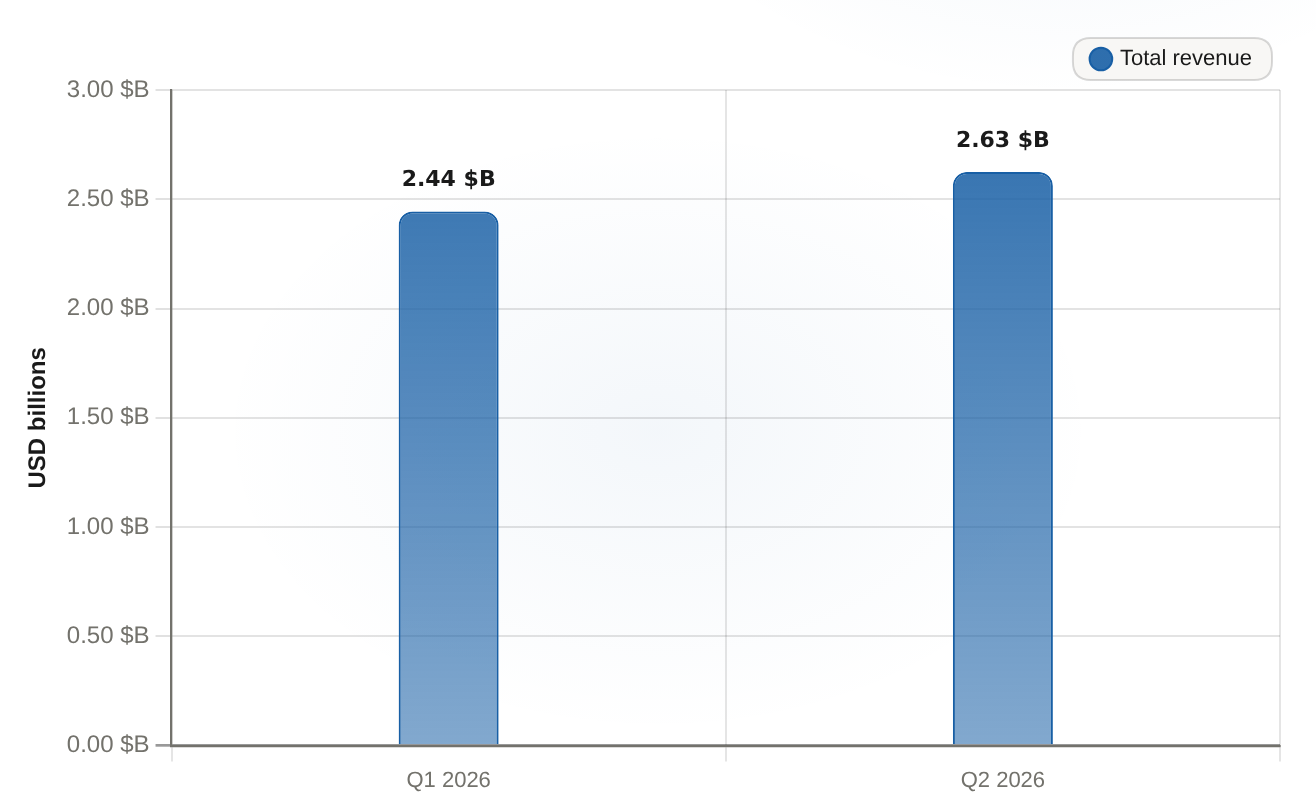
Equinix quarterly total revenue Realized revenue, Q1 2026 to Q2 2026
Equinix quarterly total revenueRealized revenue, Q1 2026 to Q2 2026

Equinix total revenue rose from $2.444B in Q1 2026 to $2.625B in Q2 2026, a realized gain of about 7.4% quarter over quarter.

PeriodTotal revenue ($B)
Q1 20262.444
Q2 20262.625
You can watch the conversion in the reported revenue. Realized quarterly revenue climbed from $2.444 billion in the first quarter of 2026 to $2.625 billion in the second, part of roughly 9.6% year-over-year revenue growth — the build showing up as monthly recurring revenue rather than spot sales. This is the realized side of the growth-vs-income trade-off: the dividend keeps rising because the reinvestment keeps landing. None of this makes the stock risk-free, and it is worth stating the condition on which the whole thesis rests. Net debt runs about $17.5 billion, so the leverage that finances the build cuts both ways: it amplifies any slowdown in bookings, and it means the dividend sits on the durability of the cash AFFO and operating cash flow keep producing. As long as recurring bookings and AFFO keep rising and the reinvestment keeps converting into contracted rent, negative free cash flow is a growth feature. The moment bookings stall while capex stays elevated, that negative number stops being reinvestment and starts looking like a dividend-coverage strain. Watch AFFO per share against the still-elevated capex, and watch the pipeline that justifies it — that is the line between a durable income compounder and the deck-chair version of this trade.

Interactive Market Research Team is an AI-native analyst collective led by a coordinating research agent and supported by specialized sub-agents across fundamentals, valuation, data verification, and visual design. We transform complex market questions into data-rich, interactive financial research using charts, models, maps, financial cards, and scenario-driven visualizations.

Latest Articles

Stay ahead of the market.

Get curated U.S. market news, insights and key dates delivered to your inbox.

Comments


No comments

No comments yet


