
Enjin Volume Spikes Fail to Spark Directional Move
 Aime Summary
Summary
- Price consolidates in a tight range between 0.0244 and 0.0254.
- Volume spikes at 07:00 and 11:00 failed to sustain directional momentum.
- Key resistance sits near 0.0254 while support holds at 0.0244.
- Market structure remains range-bound with indecision candles dominating recent hours.
- Break below 0.0244 or above 0.0254 dictates next directional move.
Range-Bound Consolidation
Enjin Coin/Tether (ENJUSDT) traded between 0.0244 and 0.0254 in the last 24 hours. Total volume reached approximately 613,059 units with a turnover consistent with recent averages. The asset displayed limited directional conviction during the reporting period.
1-Hour Support/Resistance and Candlestick Patterns
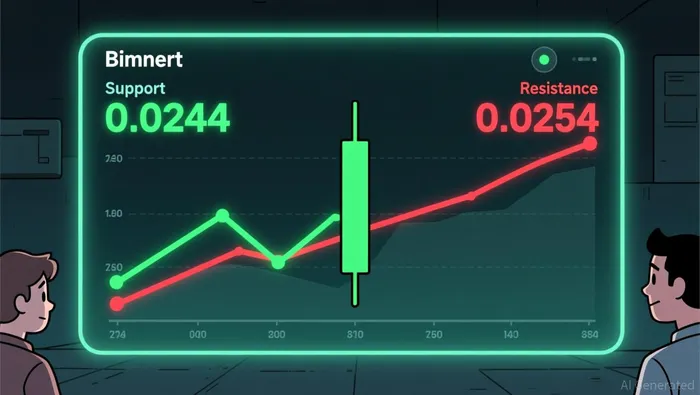
Price action suggests a clear range-bound environment where the asset oscillates between defined boundaries. The recent 1-hour data shows multiple rejections near the 0.0254 high, specifically at 13:00 and 15:00 on August 3, establishing this level as immediate resistance. Conversely, the 0.0244 low tested at 10:00 on August 4 acted as support, preventing further downside. Candlestick patterns indicate hesitation, with a long lower shadow at 01:00 on August 4 showing buying interest at 0.0249, followed by a doji with a long upper shadow at 06:00 reflecting indecision. The current price of 0.02459 is closer to the support level of 0.0244 than the resistance at 0.0254, suggesting slight bearish pressure within the range.
Volume and Turnover vs. Historical Comparison
The 24-hour total volume of 613,059 aligns closely with the 15-day average of 613,059, indicating normal trading activity relative to the broader monthly trend. However, hourly spikes were notable. At 07:00 on August 4, volume surged to 114,135, significantly exceeding the 7-day average hourly volume of 21,683. This spike coincided with a price drop from 0.02468 to 0.02456, but the subsequent hours showed no strong follow-through, as price stabilized rather than continuing the decline. Another spike occurred at 11:00 with 164,664 volume, yet the price only moved modestly from 0.02455 to 0.02465. These anomalies suggest that while volume was elevated, it did not effectively drive sustained directional movement, pointing to absorption by limit orders rather than aggressive market participation.
Look Back: Current Market Phase
Analyzing the 7 to 15-day structure reveals a market that is primarily range-bound. The 7-day price change is negative at -1.05%, while the 3-day change is slightly positive at 0.65%, indicating a lack of clear trend direction over the medium term. The price has not formed higher highs or lower highs consistently enough to suggest a strong uptrend or downtrend. Instead, the asset has been oscillating within a narrow band, consistent with a consolidation phase. This sideways movement suggests that buyers and sellers are in equilibrium, with no dominant force pushing the price decisively in either direction. The market appears to be waiting for a catalyst to break the current equilibrium.
The next 24 hours likely see continued consolidation within the 0.0244 to 0.0254 range unless a significant volume spike occurs. A break below 0.0244 could trigger further downside risk toward 0.0240, while a sustained move above 0.0254 may signal a shift toward upward momentum.

Decoding market patterns and unlocking profitable trading strategies in the crypto space
Latest Articles
Stay ahead of the market.
Get curated U.S. market news, insights and key dates delivered to your inbox.


AInvest
PRO
AInvest
PRO




Comments
No comments yet