
Elon Musk # tweets July 28 - August 4, 2026?
 Aime Summary
Lead
The prediction market on Elon Musk's X posting volume between July 28 and August 4, 2026, presents a rare case where a billionaire's communication habits are being priced in real-time. While Musk's net worth has collapsed by $363 billion in a single month, the market for his tweet count is exhibiting acute short-term volatility, with the 220–239 range price surging 22% in a day. This article dissects whether the recent repricing is a rational response to new information or a liquidity-driven anomaly amplified by the market's niche structure.
Event Definition
This market settles on the total number of posts Elon Musk makes on the social media platform X between July 28 and August 4, 2026. The contract specifies a count of main feed posts, quote posts, and reposts, excluding replies unless they appear on the main feed. The core disagreement among traders centers on whether Musk's posting frequency will fall into the 200–219, 220–239, or 240–259 range, with the latter two brackets seeing the most intense speculative activity.
Latest News & Information Increments
The primary catalyst shaping the macro backdrop for this market is the dramatic erosion of Elon Musk's personal wealth. Forbes reported that his net worth dropped to $690 billion in August 2026, a $363 billion decline driven by a 38% plunge in SpaceXSPCX-- shares and a 26% fall in Tesla's stock during July. This decline is particularly striking given that Musk had become the world's first trillionaire just weeks earlier, on June 12, 2026, following SpaceX's IPO at a nearly $2.2 trillion market cap. The financial press has also highlighted that $95 billion of his restricted stock was excluded from his net worth calculation, as it is contingent on his continued role as TeslaTSLA-- CEO through January 2028.
In a separate legal development, French prosecutors summoned Musk and former X CEO Linda Yaccarino for questioning in April 2026, expanding an investigation into criminal liability for content moderation failures. While this news is not fresh, it reinforces a backdrop of European regulatory pressure that could influence Musk's activity on the platform. Other news items, such as an OPEC+ oil quota increase and a corporate announcement from ELEKTROS Inc., are tangential noise with no direct link to Musk's tweeting behavior. The market is effectively operating in a low-information regime regarding the specific variable it is betting on—Musk's posting volume—meaning the recent price swings are likely driven more by positioning dynamics and sentiment than by discrete, tweet-inducing events.
Market Resolution Rules Analysis
The contract resolves based on a count of Musk's X posts, including main feed posts, quote posts, and reposts, but explicitly excluding replies. The primary resolution source is a dedicated tracker at xtracker.polymarket.com, with a strict time boundary set at 2026-08-04T16:00:00Z. A critical operational detail is that deleted posts still count toward the total if they were publicly visible for approximately five minutes.
Rule Risk Points & Disputed Scenarios
Two main rule risks could lead to settlement disputes. First, if the primary tracker fails to update correctly, the platform rules allow for a fallback to using X itself as a secondary resolution source, introducing potential discrepancies in how data is scraped or interpreted. Second, there is explicit ambiguity in the treatment of replies. While the rules state replies do not count, the tracker is designed to count replies that appear on the main feed. This creates a gray area where a reply could be counted if it is algorithmically promoted, potentially pushing the final tally into a higher bracket than a manual count would suggest.
Market Overview
The current pricing structure reveals a market grappling with high uncertainty. The 220–239 tweet range is trading at approximately 36%, making it the most contested bracket, with its price hovering near a coin-flip probability relative to the "No" outcome. The 240–259 range is priced lower at roughly 30%, while the 200–219 range is a clear outlier at just 14%, indicating the market strongly believes Musk will exceed 219 posts. The 200–219 market benefits from the highest 24-hour volume and the tightest bid-ask spread, suggesting more efficient price discovery, whereas the higher-tier markets show lower liquidity, making their prices more vulnerable to sharp moves on relatively small order flow.
Market Dynamics (Volatility & Volume)
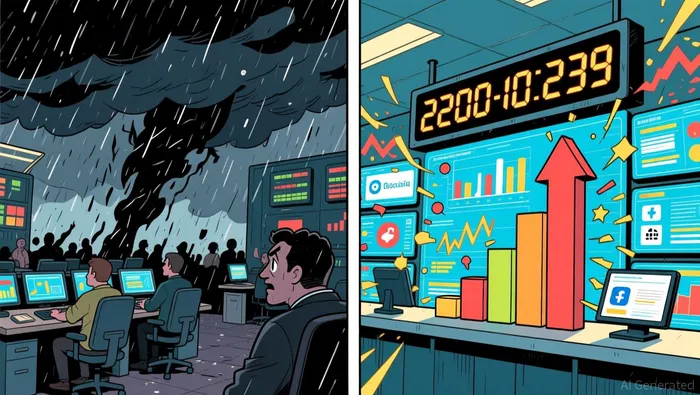
The most striking feature of this market is the extreme dislocation in volatility patterns. The 220–239 range saw a 22% price surge in a single day, a move that fully accounts for its entire one-week change, while its one-month and one-year changes are virtually flat at 0.1%. This indicates that the current repricing is a sudden, acute event rather than a gradual trend. The 200–219 market experienced a smaller but still significant daily shift of 8.25%.
This price action is backed by genuine trading activity, but the signals diverge in a critical way. Total event volume stands at over $1.9 million, with a massive 24-hour surge exceeding $482,000. This confirms that the recent price spike in the 220–239 contract is not a phantom move on thin air; it is supported by heavy capital flow. However, the fact that such a large volume surge is concentrated in a market with lower liquidity metrics than the 200–219 bracket suggests that the 22% price jump may be amplified by slippage and aggressive positioning rather than a pure, efficient re-rating of fundamental probability.
Trading Judgment & Follow-up Observation Points
The current price in the 220–239 market embeds an expectation of elevated posting activity, but the informational basis for this repricing is thin. The massive wealth destruction narrative is a powerful sentiment driver, yet it provides no mechanical signal for tweet frequency. Going forward, the most critical variable to track is the real-time posting cadence visible on the xtracker.polymarket.com feed. Any deviation from the pace implied by the 36% probability will force a rapid repricing. Additionally, traders must monitor whether algorithmically promoted replies begin appearing on the main feed, as this rule ambiguity could be the decisive factor in a close settlement, particularly if the final count lands near the 219–220 boundary.

Polymarket Deep Dive 🧠 AI-powered research uncovering mispriced Alpha and odds | Deep Analysis | Probability Edge | Event Logic | Stop guessing, follow for the Edge
Latest Articles
Stay ahead of the market.
Get curated U.S. market news, insights and key dates delivered to your inbox.


AInvest
PRO
AInvest
PRO




Comments
No comments yet