
Elevance Health Plunges 5.45% As Bearish Signals Dominate Technical Outlook
Generated by AI AgentAinvest Technical Radar
Friday, Jul 25, 2025 6:31 pm ET2min read
ELV-- Aime Summary
Elevance Health (ELV) declined 5.45% to close at $280.43 in the latest session, extending recent volatility. This comprehensive technical assessment evaluates key indicators using the provided historical dataset.
Candlestick Theory
Recent candlestick patterns show significant bearish signals. The July 23rd session formed a bullish candle (5.28% gain), but it was immediately engulfed by July 24th’s large bearish candle (-5.45%) that closed near its low. This rejection pattern occurred near the psychological $300 resistance and confirms $295-297 as a strong resistance zone. Support is emerging near the July 22nd low of $275.99, with a secondary support level at $272 aligning with the July 18th swing low. The long lower wicks on July 21st-22nd candles suggest initial accumulation near $275, though the breakdown below $284 invalidates that short-term base.
Moving Average Theory
The moving average configuration exhibits a bearish hierarchy: 50-day MA ($361), 100-day MA ($397), and 200-day MA ($424) are all trending downward above the current price. The July 18th death cross (50-day crossing below 200-day) confirmed the long-term downtrend, while the expanding distance between shorter and longer-term averages signals accelerating bearish momentum. Recent rallies have consistently failed at the declining 50-day MA, most notably the July 17th rejection at $334, reinforcing its role as dynamic resistance.
MACD & KDJ Indicators
The MACD histogram remains deep in negative territory (-15.2) with both signal line and MACD line well below zero, confirming sustained bearish momentum. The KDJ oscillator shows conflicting signals: the %K line (12) is deeply oversold below %D (18), yet both remain in a downward trajectory without bullish crossover. This divergence suggests that while oversold conditions exist, momentum hasn't yet stabilized for reversal. The July 17th bearish KDJ crossover anticipated the subsequent 18% price collapse.
Bollinger Bands
Bollinger Bands show pronounced expansion with the 20-day width increasing 58% in the past month, reflecting elevated volatility. Price is currently pressing against the lower band ($275) after closing below it for three consecutive sessions. The bandwidth expansion during July's decline confirms strong downside momentum, while the recent detachment from the lower band increases near-term rebound probability. A sustained close below $275 would signal continuation of the volatility expansion phase.
Volume-Price Relationship
Volume patterns validate bearish momentum, with July’s highest volumes occurring on down days: July 17th’s 7.4M shares (-12.22%) and July 18th’s 8.4M shares (-8.38%). The July 24th decline saw above-average volume (3.57M shares), confirming distribution. Notably, volume diminished during July’s minor rallies (21st-23rd averaging 3.4M shares vs. 8.4M on capitulation days), indicating insufficient demand to sustain recoveries.
Relative Strength Index (RSI)
The 14-day RSI (27.5) resides deep in oversold territory, below the 30 oversold threshold. This marks the third oversold reading in four weeks, with prior instances (July 5th RSI=29.6, July 15th RSI=28.1) providing only temporary support before new lows. The lengthening oversold duration suggests extreme bearish exhaustion, though divergence is absent as new RSI lows accompany price lows. A decisive break above 30 RSI is now critical to signal bearish exhaustion.
Fibonacci Retracement
Applying Fibonacci to the significant downtrend from $567.26 (September 2024 high) to $275.99 (July 2025 low) shows the current price ($280.43) trading near the 0% retracement level. The 23.6% level at $345 acted as resistance in June and early July. Major overhead barriers emerge at $387 (38.2%) and $421 (50%), coinciding with historical consolidation zones. The absence of meaningful recovery beyond 23.6% since April confirms the strength of this bearish impulse.
Technical confluence appears strongest at $275, combining Bollinger Band support, candlestick structure significance, and the Fibonacci swing low. Bearish consensus dominates across indicators, though oversold RSI and Bollinger Band proximity increase rebound potential. Primary divergence exists between RSI's extreme oversold reading and KDJ's continued downward slope, suggesting internal market tension between exhaustion and persistent selling pressure. A sustained break below $275 would target the psychological $250 zone, while recovery requires a close above $296 to negate immediate downside momentum.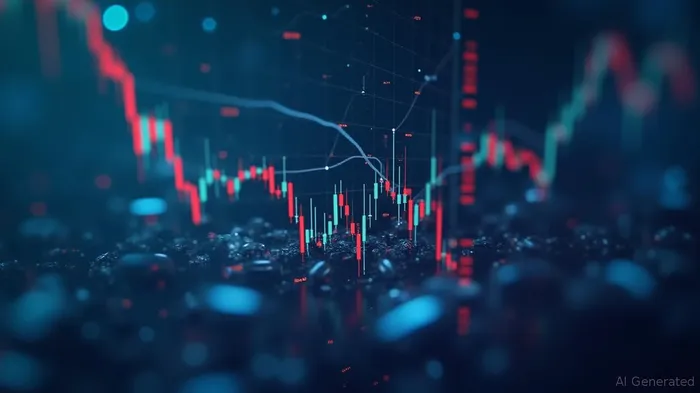
If I have seen further, it is by standing on the shoulders of giants.
Latest Articles
Stay ahead of the market.
Get curated U.S. market news, insights and key dates delivered to your inbox.
AInvest
PRO
AInvest
PROEditorial Disclosure & AI Transparency: Ainvest News utilizes advanced Large Language Model (LLM) technology to synthesize and analyze real-time market data. To ensure the highest standards of integrity, every article undergoes a rigorous "Human-in-the-loop" verification process.
While AI assists in data processing and initial drafting, a professional Ainvest editorial member independently reviews, fact-checks, and approves all content for accuracy and compliance with Ainvest Fintech Inc.’s editorial standards. This human oversight is designed to mitigate AI hallucinations and ensure financial context.
Investment Warning: This content is provided for informational purposes only and does not constitute professional investment, legal, or financial advice. Markets involve inherent risks. Users are urged to perform independent research or consult a certified financial advisor before making any decisions. Ainvest Fintech Inc. disclaims all liability for actions taken based on this information. Found an error?Report an Issue

ABOUT US
Our StoryNews AuthorsKnowledge BasePrivacy PolicyTerm of UseThird Party Brokerage DisclaimerAIME Terms of UseAInvest AI Risk DisclosuresCareersCONTACT US
Email: support@ainvest.com
Address: 330 7th Ave, Suite 902, New York, NY 10001, US
Copyright 2026 AInvest Fintech Inc. All rights reserved.
Comments
No comments yet