
Echostar (SATS) Rises 7.63% on Three-Day Streak as Technical Indicators Signal Breakout
Echostar (SATS) has surged 7.63% in the most recent session, marking a three-day winning streak with a cumulative gain of 19.22%. The stock’s recent price action reflects strong bullish momentum, with a sharp rally from the 74.5–74.03 range (Dec 4–5) to the current 88.26 high. This suggests a potential breakout from a consolidation phase, supported by a rising 50-day and 100-day moving average (calculated as ~82.5 and ~78.0, respectively). The 200-day MA (~74.0) remains below the current price, indicating a medium-term uptrend. Key support levels are likely near 74.5 (Dec 4 close) and 70.88 (Nov 26 low), while resistance is now at 88.26 and potentially 90.3964 (Dec 8 high).
Candlestick Theory 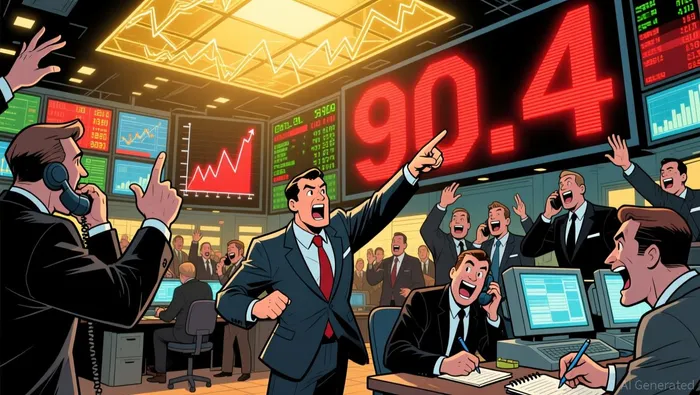 The recent three-day rally forms a bullish engulfing pattern, with large bodies and minimal wicks, signaling strong buying pressure. The price has also tested and held above a key support-turned-resistance level at 74.5–74.03, reinforcing its role as a psychological pivot. A potential harami pattern may emerge if the price consolidates within the Dec 5–4 range, but the current trajectory suggests a continuation of the uptrend.
Moving Average Theory
Short-term momentum aligns with the 50-day MA, which has steeply sloped upward to intersect the 100-day MA, forming a golden cross. This confluence of moving averages validates the bullish bias. However, the 200-day MA lags significantly below, indicating a potential divergence if the rally falters. A close above 88.26 could trigger a retest of the 90.3964 high (Dec 8), while a pullback below 74.5 may trigger a reevaluation of the trend.
MACD & KDJ Indicators
The MACD histogram has expanded positively, with the line above the signal line, confirming upward momentum. The KDJ (Stochastic) oscillator is in overbought territory (K ~85, D ~80), suggesting a potential pause or consolidation. However, the divergence between the KDJ and the MACD—where the MACD remains strong while the KDJ shows fatigue—hints at a possible overbought correction without a reversal.
Bollinger Bands
The price has recently touched the upper Bollinger Band (at ~90.4), a sign of high volatility. The bands have widened after a period of contraction in late November, indicating a breakout phase. If the price stays within the bands, the uptrend is likely to persist; a break above the upper band may signal a continuation of the rally, while a retest of the lower band (~74.5) could act as a critical support.
Volume-Price Relationship
Trading volume has surged on the recent up days (e.g., 10.5M shares on Dec 8 vs. 2.2M on the prior day), validating the strength of the rally. However, the volume on Dec 5 (28.6M) was also high during the 10.07% jump, suggesting the uptrend has institutional participation. A decline in volume during consolidation phases may indicate waning momentum.
Relative Strength Index (RSI)
The RSI is currently near 70, entering overbought territory, but this is not uncommon in strong trends. A close below 60 would suggest a pullback, while a sustained move above 70 may indicate a new phase of strength. The 30–70 range remains a watchpoint for potential mean reversion.
Fibonacci Retracement
Key Fibonacci levels from the Nov 14 low (65.76) to the Dec 8 high (88.26) are at 61.8% (~81.5) and 78.6% (~84.5). The price is currently above the 78.6% level, suggesting a potential extension to the 90.4 target. A retest of the 61.8% level could act as a support, but a breakdown below 81.5 may invalidate the bullish case.
Confluence and Divergences
The most critical confluence occurs at the 74.5 support/resistance level, where moving averages, Fibonacci, and Bollinger Bands align. If the price holds here, the uptrend remains intact. Divergences between the KDJ and MACD suggest caution: while the MACD remains bullish, the overbought KDJ may signal a short-term pullback. However, the rising volume and strong candlestick patterns suggest the rally could continue. Traders should monitor the 74.5 level for support and the 90.4 upper band for potential overextension.
If I have seen further, it is by standing on the shoulders of giants.
Latest Articles
Stay ahead of the market.
Get curated U.S. market news, insights and key dates delivered to your inbox.

Comments
No comments yet