
DOGSUSDT Volume Spikes, But Price Remains Trapped
 Aime Summary
Summary
- DOGSUSDT consolidates near 3.0e-05 after recent volatility and structural range-bound behavior.
- Key resistance sits at 4.0e-05 while support holds firmly at 3.0e-05 level.
- Volume spikes on August 2 and 3 show high activity without sustained directional follow-through.
- Market appears trapped in a tight range with indecisive candlestick patterns dominating recent hours.
- Next 24 hours likely see continued consolidation unless key levels are decisively broken.
Market Overview
DOGS/Tether (DOGSUSDT) traded between 3.0e-05 and 4.0e-05 over the last 24 hours, with a total volume of approximately 638 million tokens. The asset remains locked in a tight range with significant volume anomalies but limited price progression.
1-Hour Support/Resistance and Candlestick Patterns
Price action has repeatedly rejected the upper boundary near 4.0e-05, establishing it as a strong resistance level, while the 3.0e-05 level has acted as consistent support. The market structure is currently range-bound, with price hovering closer to the support zone. Candlestick analysis reveals long upper shadows and doji patterns, particularly around the 2.0e-05 to 4.0e-05 transitions, indicating indecision and rejection of higher prices. The narrow bodies and wicks suggest that buyers and sellers are evenly matched, with no clear engulfing patterns driving a breakout.
Volume and Turnover vs. Historical Comparison
The 24-hour volume significantly exceeds the 7-day average single-hour volume, with notable spikes recorded on August 2 at 20:00 and August 3 between 06:00 and 09:00. These hours showed volume levels well above the 2x threshold of the 7-day average, yet price movement remained minimal or reversed quickly. For instance, the spike at 20:00 on August 2 did not lead to a sustained upward move, suggesting absorption by sellers. Similarly, the activity on August 3 morning resulted in a small move to 4.0e-05 but failed to hold, indicating that the volume anomalies did not drive effective price discovery. This high volume with low price change suggests accumulation or distribution rather than a clear directional trend.
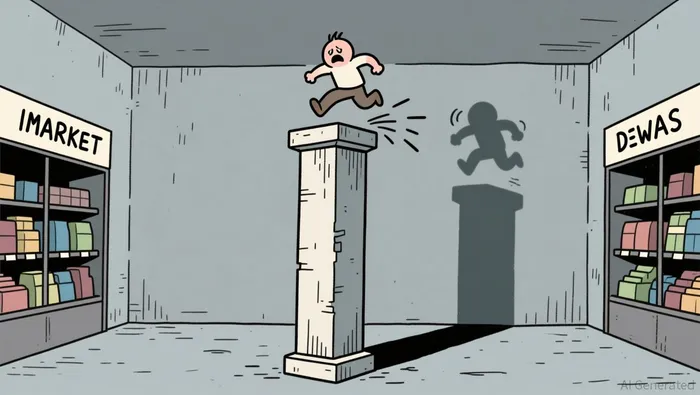
Look Back: Current Market Phase
Over the past 7 to 15 days, the market has exhibited a sideways or range-bound phase, characterized by lower highs and lows interspersed with sharp, unstructured moves. The price has not established a clear uptrend or downtrend, instead oscillating within a defined channel. The recent 33.33% move in the last 3 days appears to be a deviation from the mean rather than a new trend initiation, given the immediate reversion and consolidation. The market is currently in a consolidation phase, waiting for a catalyst to break the established range.
The next 24 hours may see continued consolidation within the 3.0e-05 to 4.0e-05 range. A break above 4.0e-05 could signal upside potential, while a drop below 3.0e-05 may expose downside risk to lower support levels.

Decoding market patterns and unlocking profitable trading strategies in the crypto space
Latest Articles
Stay ahead of the market.
Get curated U.S. market news, insights and key dates delivered to your inbox.


AInvest
PRO
AInvest
PRO




Comments
No comments yet