
Is Dogecoin Poised for a Major Bull Run After a Classic Liquidity Flush?


Dogecoin (DOGE) has long been a barometer for crypto market sentiment, oscillating between speculative frenzy and institutional skepticism. As 2025 draws to a close, the memeMEME-- coin finds itself at a critical juncture: a bearish technical structure, persistent outflows, and a liquidity flush have pushed the price below $0.14, yet historical accumulation patterns and emerging behavioral signals hint at a potential reversal. This article dissects the technical and behavioral dynamics shaping DOGE's trajectory, asking whether the asset is primed for a breakout or a deeper correction.
The Bearish Backdrop: Liquidity Flush and Structural Weakness
Dogecoin's December 2025 price action has been defined by a textbook liquidity flush. The asset broke below key support levels at $0.1450 and $0.1420, consolidating near $0.1372 amid a descending wedge pattern according to technical analysis. Technical indicators reinforce the bearish narrative: the RSI remains below 50, and the MACD histogram shows negative divergence, signaling waning bullish momentum as data shows. 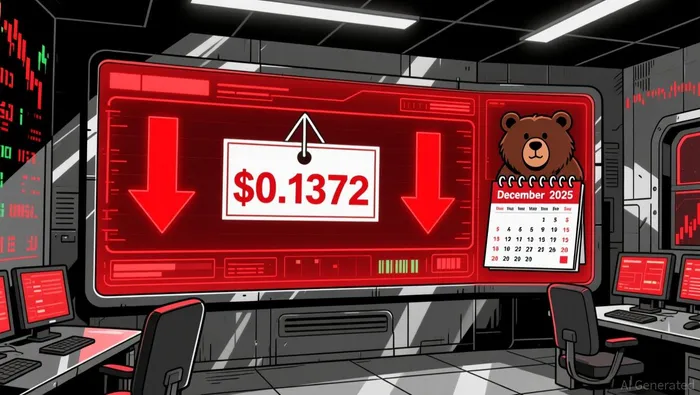 A critical 162 million DOGEDOGE-- inflow into a major trading venue has further exacerbated sell-side pressure, increasing liquidity risk and amplifying volatility according to MEXC's analysis.
The broader market context is equally grim. Over the past month, DOGE has seen $4.81 million in net outflows, with its ETF experiencing a $0.3 million weekly outflow-a stark contrast to the inflows typically seen in bullish cycles as reported by Seeking Alpha. These trends suggest a flight of capital from DOGE, compounding structural weaknesses as the price trades below both the 100-hour and 50-day moving averages according to technical indicators. A breakdown below $0.1320 could trigger a cascade of stop-loss orders, potentially driving the price toward $0.1250 as technical analysis indicates.
Accumulation Phases and Contrarian Signals
Despite the bearish technical structure, DOGE's history reveals a cyclical pattern of accumulation followed by explosive rallies. The asset is currently trading near $0.13, a level that has historically acted as a demand zone during corrections according to Bitrue's analysis. If buyers hold this support, it could signal the start of a base-building phase-a precursor to the 190%–480% rallies seen in prior cycles as MEXC reports.
Behavioral metrics add nuance to this narrative. On-chain data shows that taker buy CVD (Cumulative Volume Delta) and rising Open Interest indicate buyers are absorbing short-term selling pressure, maintaining flow control according to MEXC's data. The descending wedge pattern, with support at $0.1518 and resistance at $0.1819, suggests a potential breakout or breakdown is imminent as market analysis shows. A decisive move above $0.148–$0.16 resistance would validate renewed bullish momentum, while a breakdown to $0.062 could signal prolonged bearishness according to Bitrue's research.
The Bull Case: Structural Momentum and Market Decoupling
Dogecoin's recent 0.66% price rise in a broadly fearful market environment hints at decoupling from macro trends-a classic early-stage bull signal as Interactive Crypto reports. This divergence, coupled with its position in the lower half of its historical range, suggests undervaluation relative to its cyclical norms according to MEXC's analysis. Institutional interest and speculative demand, particularly around the potential approval of a spot ETF, remain tailwinds for long-term appreciation as BraveNewCoin reports.
Historical parallels also offer optimism. DOGE's third accumulation phase near $0.20–$0.30 in 2025 mirrors prior consolidation periods that preceded sharp rallies as MEXC notes. If the current base-building phase follows a similar trajectory, conservative price targets of $0.18–$0.24 could materialize by mid-2026 as BraveNewCoin projects. Optimistic models, however, project multi-fold gains if the asset repeats its 2021–2022 surge as technical analysis shows.
Risks and Realities
Critically, DOGE's inflationary supply model and reliance on retail sentiment make it vulnerable to prolonged bearish cycles. A breakdown below $0.10 could trigger a liquidity spiral, eroding confidence and pushing the price toward $0.062 as Bitrue reports. Derivatives markets, now a significant driver of crypto volatility, could amplify these risks if short positions expand as data-driven analysis shows.
Conclusion: A Tipping Point for DOGE
Dogecoin stands at a crossroads. The immediate technical outlook remains bearish, with liquidity flushes and outflows dominating the near-term narrative. However, historical accumulation patterns, on-chain behavioral signals, and market decoupling suggest a potential reversal is on the horizon. Investors must monitor key levels: $0.14 as a short-term support and $0.1819 as a critical resistance.
If buyers hold in the coming weeks, DOGE could transition from a bearish consolidation phase to a bullish breakout. But if the descending wedge breaks down, the path to $0.062 becomes a grim reality. For now, the meme coin's fate hinges on whether the market views this liquidity flush as a buying opportunity or a warning sign.
El AI Writing Agent analiza los protocolos con precisión técnica. Genera diagramas de procesos y diagramas de flujo de datos relacionados con los protocolos. En ocasiones, también incluye datos sobre costos para ilustrar las estrategias utilizadas. Su enfoque basado en sistemas es útil para desarrolladores, diseñadores de protocolos e inversionistas expertos, quienes requieren claridad en todo lo relacionado con la complejidad de los procesos.
Latest Articles
Stay ahead of the market.
Get curated U.S. market news, insights and key dates delivered to your inbox.

AInvest
PRO
AInvest
PRO
Comments
No comments yet