
Is Dogecoin Poised for a 30-40% Breakout as Symmetrical Triangle and Derivatives Data Signal Critical Inflection Point?


The cryptocurrency market has long been a theater of volatility, but DogecoinDOGE-- (DOGE) in August 2025 is staging a particularly compelling act. The token has consolidated within a symmetrical triangle pattern—a classic technical formation that often precedes a decisive breakout. For traders and investors, the question is no longer whether DOGEDOGE-- will break out, but how it will do so. The confluence of technical indicators, derivatives-driven sentiment imbalances, and macro-level catalysts suggests a pivotal moment for the meme coin, with a potential 30-40% move on the table.
Technical Validation: A Triangle of Opportunity
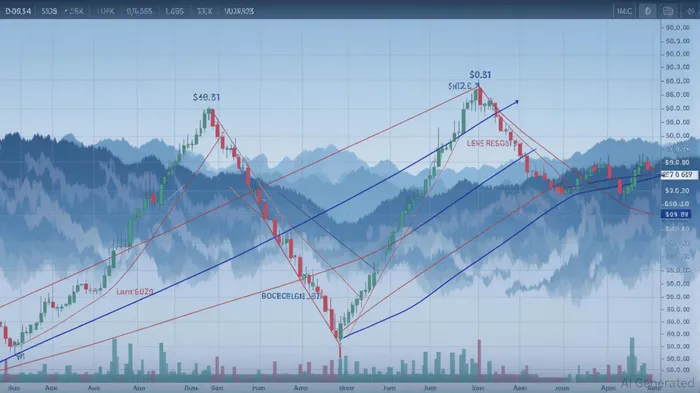
The symmetrical triangle pattern, defined by converging trendlines connecting swing highs at $0.25 and swing lows at $0.22, has been a focal point for analysts. As of late August, DOGE hovers near $0.2366, a price that sits at the heart of this tightening range. The pattern's validity hinges on a breakout above $0.25 or a breakdown below $0.22.
Technical analysts, including crypto commentator Ali Martinez, note that the final wave of the triangle's formation—wave E on the daily chart—has completed, signaling the end of consolidation. A confirmed breakout above $0.25 would align with the continuation bias of the pattern, potentially propelling DOGE toward $0.31 (a 30% gain) or even $0.35. Crucially, this would require at least two candlestick closures above $0.25 and a surge in trading volume to validate the move. Conversely, a breakdown below $0.22 could trigger a retest of $0.19, a level last seen in early July.
Elliott Wave analysis adds another layer of confidence. DOGE appears to have completed a five-wave corrective pattern (waves A through E) on the daily chart, suggesting that a motive wave in the direction of the prior uptrend may be imminent. The RSI, currently at 71.4, is in overbought territory, a red flag for potential corrections if the breakout fails to materialize.
Derivatives Data: A Sentiment Imbalance Brewing
The derivatives market tells a story of stark contrasts. Open interest in DOGE derivatives has surged to $1.7 billion, a 50% increase since April 2025. This surge reflects heightened speculative activity, with institutional investors accumulating 2 billion DOGE since January 2025. Whale activity has further stabilized key support levels, such as $0.22, with large holders buying the dip even as retail uncertainty persists.
Retail traders, however, are in a precarious position. The long/short ratio on Binance stands at 5.67, while OKX reports a ratio of 3.89, indicating an overbought and crowded long position. Over the past week, $18.27 million in liquidations were recorded, with longs accounting for $13.53 million. This imbalance suggests that a failed breakout could trigger a sharp correction, as leveraged longs are forced to unwind.
Institutional confidence, meanwhile, remains robust. Whale accumulation of 1.08 billion DOGE in 48 hours—worth $250 million—signals long-term bullish positioning. The golden cross (50-day MA above 200-day MA) and a double-bottom pattern on the price chart further reinforce this view. Yet the market's fragility is evident in the flat MACD indicator and the Fear & Greed Index, which sits at 74, reflecting retail optimism that may be overestimating the likelihood of a sustained rally.
Risk-Reward Analysis: A High-Stakes Game
For near-term traders, the risk-reward profile is compelling but not without caveats. A confirmed breakout above $0.25 would justify aggressive long positions, with a stop-loss placed just below $0.22 and profit targets at $0.26–$0.28. If the price fails to hold above $0.25, however, the risk of a breakdown to $0.19 looms large. Position sizing should be limited to 5–10% of a portfolio to manage the asset's inherent volatility.
The macroeconomic backdrop adds another layer of complexity. The 80% probability of a Dogecoin ETF approval by September 2025 could unlock institutional-grade liquidity, pushing the price into the $0.30–$0.40 range. Yet delays or rejections could trigger a liquidity crunch, testing the $0.19 support level. Traders must also monitor Bitcoin's performance, as broader crypto market sentiment often dictates DOGE's direction.
Conclusion: A Calculated Bet in a Volatile Arena
Dogecoin's August 2025 price action presents a textbook case of technical and sentiment-driven dynamics. The symmetrical triangle pattern, combined with derivatives data showing institutional accumulation and retail overbought conditions, creates a high-probability scenario for a breakout. However, the risks are equally pronounced: overleveraged longs, fragile momentum, and macroeconomic uncertainties could just as easily lead to a sharp correction.
For disciplined traders, the key is to treat this as a high-risk, high-reward opportunity. A confirmed breakout above $0.25 with volume confirmation would justify aggressive entry, while a breakdown below $0.22 demands swift exit. The coming weeks will test whether DOGE can capitalize on its technical setup and institutional tailwinds—or whether it will succumb to the fragility of its retail-driven optimism.
In the end, the market is not a gamble but a calculation. And for those who approach it with rigor, the rewards may be worth the risk.
Decoding blockchain innovations and market trends with clarity and precision.
Latest Articles
Stay ahead of the market.
Get curated U.S. market news, insights and key dates delivered to your inbox.

AInvest
PRO
AInvest
PRO
Comments
No comments yet