
Dogecoin News Today: Dogecoin Surges 26.11% in Week, Breaks Technical Resistance
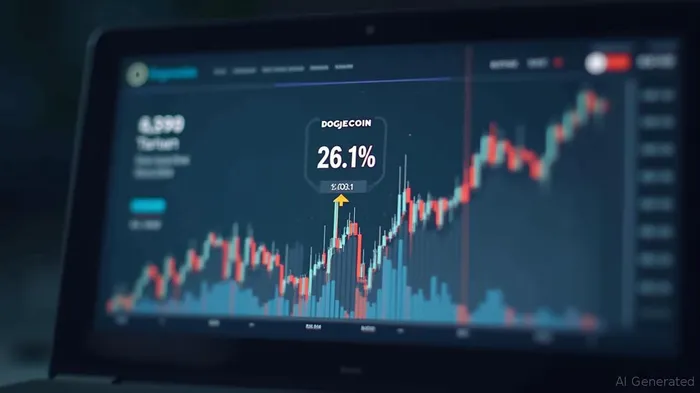
Dogecoin has experienced a significant surge, with its price increasing by 26.11% over the past week, reaching $0.25047. This upward movement is accompanied by a technical breakout on the weekly chart, marked by the expansion of the Bollinger Bands after a prolonged period of compression. The widening of the Bollinger Bands indicates a shift from low volatility to a more volatile phase, as the upper and lower bands begin to diverge.
The recent price action has seen Dogecoin push past the middle Bollinger Band level, which previously acted as resistance. The current candle on the chart features a large bullish body, suggesting that buyers are in control following a phase of sideways trading. This breakout is particularly notable as it follows several weeks of consolidation, adding weight to the sudden price increase.
In tandem with the technical breakout, Dogecoin's 24-hour trading volume has increased by 10.93%, reaching $6.14 billion. This surge in volume supports the idea that the recent price action is backed by active trading rather than isolated orders. The market capitalization of Dogecoin has also risen by 4.32%, currently standing at $37.85 billion. This increase in market capitalization reflects not only the rise in price but also the heightened number of transactions within the same time frame.
The chart indicates that Dogecoin's price is now testing a resistance zone near the upper Bollinger Band. This area has previously triggered multiple reversals between late 2024 and early 2025. However, the expanding bands suggest potential for further movement if the momentum continues. Currently, the price sits above both the 20-week moving average and the middle band, aligning with prior bullish phases.
The Bollinger Band squeeze that began earlier in 2025 appears to have ended, with the indicators now showing widening bands. This configuration typically signals rising volatility. The price levels on the chart confirm that Dogecoin has broken above recent resistance zones, and the lower Bollinger Band has started to curve downward, indicating that the compression phase has concluded.
As Dogecoin maintains its position above the midline, attention is focused on the evolution of the next few candles. The continuation of this pattern may influence trader reactions to the developing structure. As of the current weekly session, Dogecoin is firmly above its recent range, with technical indicators suggesting a transition out of the consolidation phase.
Stay ahead of the market.
Get curated U.S. market news, insights and key dates delivered to your inbox.


AInvest
PRO
AInvest
PRO
Comments
No comments yet