
Dogecoin News Today: Dogecoin Forms Bullish Harami Pattern Above $0.20 Support Level
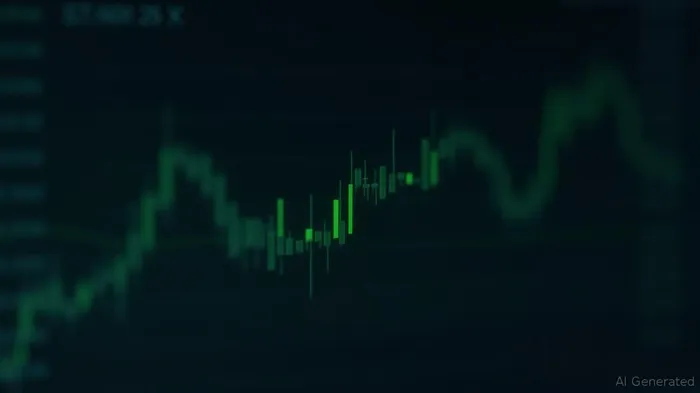
Dogecoin has formed a Bullish Harami pattern above the $0.20 support level, signaling a potential early-stage reversal following a recent downtrend. This technical pattern, characterized by a smaller bullish candle contained within the range of a preceding bearish candle, indicates weakening selling pressure and growing buyer momentum. The pattern appeared on the daily chart after a sustained decline from July 27 to August 2, marked by a large bearish candle followed by a contained bullish candle. Despite the continuous nature of cryptocurrency trading—which negates the need for a traditional gap-up—this pattern remains a valid indicator of a possible trend reversal [1].
The price action on August 3 saw Dogecoin close at $0.2021, with intraday trading between $0.1959 and $0.2038, marking a 3.0% gain. This movement reflects a shift in market sentiment, as the price has held steady above the $0.20 support level with consistent trading volume. The stability above this level is a key component in validating the Bullish Harami pattern and suggests renewed confidence among market participants. According to CoinGecko data, Dogecoin’s market capitalization stands at $30.38 billion, with a 24-hour trading volume of $1.43 billion and a circulating supply of 150.36 billion tokens [1].
Market analyst Chris noted that Dogecoin has retested its bull market support band and successfully flipped the downtrend line into support. He remarked, “This might have just been the ultimate shakeout before the real fun up.” Additionally, investors have added over 818,000 DOGE tokens to their portfolios, indicating increased accumulation and renewed demand. While further price confirmation is required, these developments support a cautiously optimistic outlook for Dogecoin’s near-term direction [1].
The Bullish Harami pattern, which forms when a smaller green candle closes within the body of a larger red candle, is a classic technical reversal signal. In the context of Dogecoin, this pattern suggests that sellers are losing control, and buyers are stepping in to take over. Maintaining the $0.20 support level is crucial for reinforcing the pattern’s validity and maintaining market confidence. The recent buying activity and stable volume indicate that the market structure remains intact, providing a solid foundation for potential upward movement [1].
In summary, Dogecoin’s formation of a Bullish Harami pattern above the $0.20 level marks a significant technical development. The pattern, supported by stable volume and increased accumulation, suggests a possible early reversal in its recent downtrend. Market participants are advised to monitor price continuation for further confirmation, as this pattern may indicate the start of renewed upward momentum in Dogecoin’s market trajectory [1].
Source: [1] Dogecoin Forms Bullish Harami Pattern Above $0.20, Suggesting Possible Early Reversal (https://en.coinotag.com/dogecoin-forms-bullish-harami-pattern-above-0-20-suggesting-possible-early-reversal/)
Stay ahead of the market.
Get curated U.S. market news, insights and key dates delivered to your inbox.


AInvest
PRO
AInvest
PRO
Comments
No comments yet