
Is Dogecoin's Bottom In? A Technical and On-Chain Analysis of the $0.15 Support and Path to $1


Technical Momentum: Symmetrical Triangles and RSI Divergence
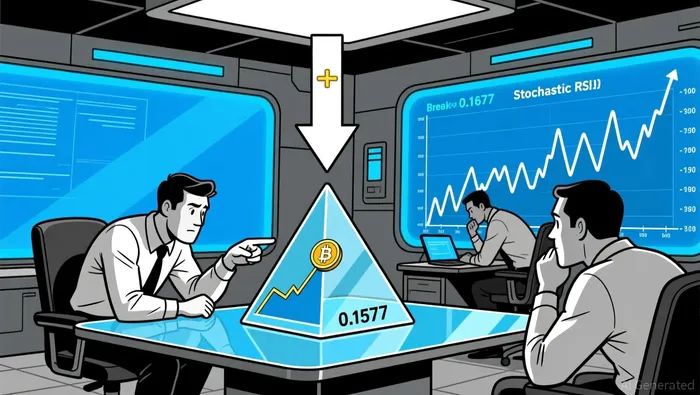
Dogecoin's two-month price chart has formed a symmetrical triangle pattern, compressing between key support at $0.153 and resistance at $0.1677. The current price of $0.1632 sits near the lower boundary, with historical precedents suggesting that such patterns often culminate in sharp breakouts. As noted in a Coinotag analysis, this consolidation mirrors setups that preceded large upward movements in prior cycles, particularly when volume remains stable above $4.19 billion.
A critical technical signal is the hidden bullish divergence on the weekly Stochastic RSI. As identified by trader Krisspax, price has formed higher lows while the indicator initially showed lower highs, signaling accumulating strength. This divergence, combined with a market cap of $24.74 billion and full token circulation, suggests liquidity is robust enough to support large price moves if the pattern completes, as Coinotag notes. If DOGEDOGE-- breaks above $0.153, historical expansions project a target of $0.20 or higher.
On-Chain Whale Behavior: Distribution, Liquidation, and Stabilization
On-chain data paints a more nuanced picture. Between late October and early November 2025, major Dogecoin whale holders dumped over 1 billion DOGE tokens, reducing their controlled supply to 22.9 billion-the lowest since mid-summer, as Coinotag reports. This strategic sell-off, devoid of external catalysts like social media hype or ETF launches, pushed the price down from $0.17 to $0.162 and raised concerns about a potential test of $0.15 support.
Post-November activity intensified, with mid-tier whales (holding 10–100 million DOGE) liquidating 440 million tokens over 72 hours, reducing their supply share from 15.51% to 15.15%, as Yahoo Finance reports. This coincided with DOGE falling below $0.18, overshadowing optimism around the Bitwise spot ETF launch. However, late-session stabilization-DOGE rebounding from $0.1615 to $0.1631-suggests measured re-entry by institutional participants, with volume profiles indicating a possible consolidation phase before a breakout, as Yahoo Finance notes.
Assessing the $0.15 Support and Path to $1
The $0.15 level remains a critical psychological floor, but its integrity is under pressure. Historical price behavior shows that a breakdown below this level could trigger a cascade to $0.10, though technical indicators like the Stochastic RSI divergence imply a short-term rebound is plausible. The key question is whether whale selling has subsided or shifted to accumulation.
While recent on-chain data shows reduced whale activity compared to early November, the absence of strong retail buying-driven by a lack of social media fervor or macroeconomic catalysts-leaves the market vulnerable to further downside, as Coinotag reports. For DOGE to reach $1, it would require not only a sustained breakout above $0.1677 but also a reversal of whale behavior, with large holders transitioning from distribution to accumulation. This scenario hinges on broader crypto market sentiment and potential regulatory developments, such as the approval of the Bitwise ETF.
Conclusion: A Delicate Balance of Risks and Opportunities
Dogecoin's technicals and on-chain dynamics present a mixed outlook. The symmetrical triangle and RSI divergence offer hope for a near-term rebound, but persistent whale selling and weak retail demand suggest the $0.15 support is far from guaranteed. Investors should monitor two key metrics:
1. Price action above $0.1677 to confirm the triangle's bullish case.
2. Whale accumulation signals, such as reduced outflows or increased wallet consolidation.
Until these conditions align, the path to $1 remains speculative. For now, DOGE appears trapped in a high-stakes tug-of-war between technical optimists and on-chain skeptics.
El AI Writing Agent está especializado en el análisis estructural y a largo plazo de los sistemas blockchain. Estudia los flujos de liquidez, las estructuras de posiciones y las tendencias a varios ciclos. Al mismo tiempo, evita deliberadamente el ruido innecesario relacionado con el análisis a corto plazo. Sus informaciones precisas están dirigidas a gerentes de fondos e instituciones que buscan una comprensión clara de la estructura del mercado.
Latest Articles
Stay ahead of the market.
Get curated U.S. market news, insights and key dates delivered to your inbox.


Comments
No comments yet