
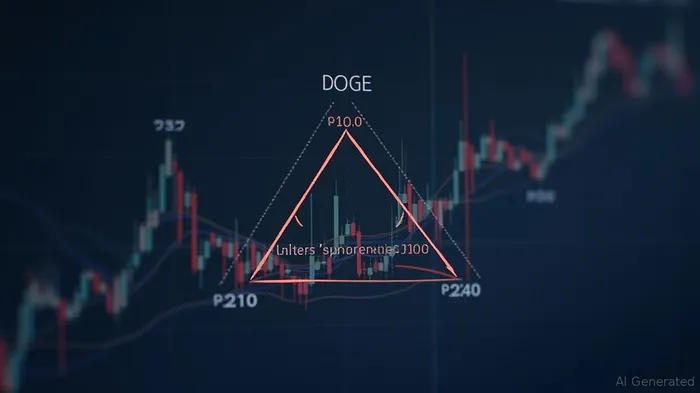
DOGE Forming Symmetrical Triangle Amid $0.190 Support and $0.243 Resistance Breakout Potential
Dogecoin is currently forming a symmetrical triangle pattern on the 4-hour chart, with price consolidating between descending resistance at $0.243 and ascending support near $0.190. The pattern, identified by analysts including Ali Charts, has been developing since late July following a decline from $0.315 to a key support level at $0.190, which has held firm so far [1]. Price has oscillated between these levels, with buyers stepping in at higher lows while facing rejection at the $0.243 resistance level, a key Fibonacci 0.618 retracement level [1].
The apex of the triangle is projected to align with August 22, 2025, indicating a potential breakout window is approaching. As volatility decreases and price movements become tighter, traders are closely monitoring for a decisive move either above or below the pattern. A clean breakout above $0.243 could lead to a 30% upward move, pushing DOGEDOGE-- into higher price territory. Conversely, a breakdown below $0.190 would suggest renewed bearish momentum [1].
Price has already tested $0.243 multiple times, most recently in early August, though it has failed to sustainably hold above that level. The current price of $0.228 sits just above the 0.5 retracement level at $0.232, reinforcing the idea that the market remains in a state of balance, with both buyers and sellers exerting influence [1]. On the downside, the $0.190 support zone remains a critical floor. A breakdown below this level could shift the near-term bias to the bearish side, potentially retesting lower price levels.
On the technical front, the price has also broken below a rising channel on the hourly chart, with support currently at $0.2295. This further suggests short-term weakness and highlights the importance of watching for signs of stability or renewed strength [1]. The convergence of trendlines within the triangle pattern indicates that the market is nearing a point of resolution, with limited room for further consolidation.
As the pattern approaches its apex, the focus remains on whether DOGE can gather enough bullish momentum to break through the $0.243 resistance level cleanly. A confirmed breakout would provide a clear direction and potentially unlock significant volatility. Conversely, a breakdown would signal a return to lower price levels and renewed bearish pressure.
Source: [1] Can DOGE Break $0.243 Resistance? Triangle Pattern Suggests Major Move Ahead (https://cryptofrontnews.com/can-doge-break-0-243-resistance-triangle-pat/)
Stay ahead of the market.
Get curated U.S. market news, insights and key dates delivered to your inbox.


Comments
No comments yet