
Does the VIX Spike Mark a Bottom?
Equities have been on a wild ride the past couple of weeks. There have been several factors involved:
Bank of Japan delivered a hawkish surprise by hiking rates and announcing a tapering of assets last Wednesday, setting off an unwind of the carry trade.
The Fed did not provide the dovish tone that some had hoped it would. There were calls for emergency cuts but the central bank decided to keep its data dependent mantra, leaving some to believe that it remains behind the curve.
Earnings data has been steady but has failed to impress. The S&P 500 is on pace to post YoY EPS gains of approximately 10% but beats have been lower than historical norms. Revenue has been a bigger worry, adding to the growth concerns and leading many to believe that improved profitability has been primarily through expense cuts and that corporations are running out of runway.
The July jobs report missed expectations on Friday. While the report was not terrible, it was weak enough that it led to concerns about the potential for a recession as data continues to show some weakness.
Geopolitical concerns are on the rise as tensions in the Middle East between Iran and Israel continue to rise. There are also worries that the Vice President's picks will lead to further division in the United States ahead of its election season.
The VIX exploded higher, highlighting a rising concern for investors around the stock market.
Today, we want to explain why the move in the VIX is so important for investors. We will discuss the VIX as an instrument and what the moves indicate. Finally, we will provide some instruments for our readers to monitor and trade this volatility.
What is the VIX?
The VIX, or Volatility Index, is a widely recognized measure of the stock market's expectation of volatility based on S&P 500 index options, often referred to as the fear gauge due to its tendency to spike during market turmoil and drop during stable periods.
Calculated from market pricing for S&P 500 options, it reflects expected volatility over the next 30 days. In calm periods, investors profit from betting against volatility through options-laden products, a strategy prominent in 2017 with retail vehicles explicitly shorting volatility.
Structured products can contribute to market calm by allowing banks to hedge risk and suppress volatility. When bad news hits, volatility surges as traders rush to cover losses by selling overbought assets, creating a feedback loop fueled by automatic sell orders and momentum strategies.
How the VIX Works
The VIX is calculated by the Chicago Board Options Exchange (CBOE). It is derived from the prices of S&P 500 index options. It typically has an inverse relationship with the SPX; as the SPX declines, indicating a falling stock market, the VIX rises due to increased volatility and investor fear, and vice versa.
The VIX measures implied volatility, reflecting the market's forecast of SPX movements, with higher option prices indicating higher implied volatility and a higher VIX value. It serves as a gauge of investor sentiment, where a high VIX indicates market uncertainty or fear, leading to increased selling pressure, while a low VIX suggests market stability. Investors and traders use VIX futures and options to hedge against or speculate on market volatility without directly trading the SPX or its constituent stocks.
The VIX is valuable for several reasons: it aids in risk management by allowing portfolio managers to gauge market risk and adjust strategies accordingly, with a rising VIX prompting defensiveness and a falling VIX encouraging risk-taking. Traders use the VIX for market timing, where extremely high values may signal market bottoms due to peak fear, and extremely low values may indicate market tops due to peak complacency. Additionally, the VIX correlates with significant market events, such as financial crises, geopolitical tensions, or major economic data releases, as it tends to spike during these periods, reflecting impacted investor confidence.
In periods of market calm, investors often profit from betting against volatility using products embedded with options, such as the retail tracker vehicles popular in 2017 that were explicitly short volatility. Before the current market rout, the proliferation of structured products contributed to market stability, as banks took the opposite side of these trades and hedged risks in ways that suppressed volatility. However, when bad news hits, investor fear spikes, causing volatility to surge as traders rush to cover losses, selling the most overbought assets and further increasing volatility. This is exacerbated by automatic sell orders and strategies like momentum trading and risk parity, creating a feedback loop that magnifies market swings.
An Historic Monday
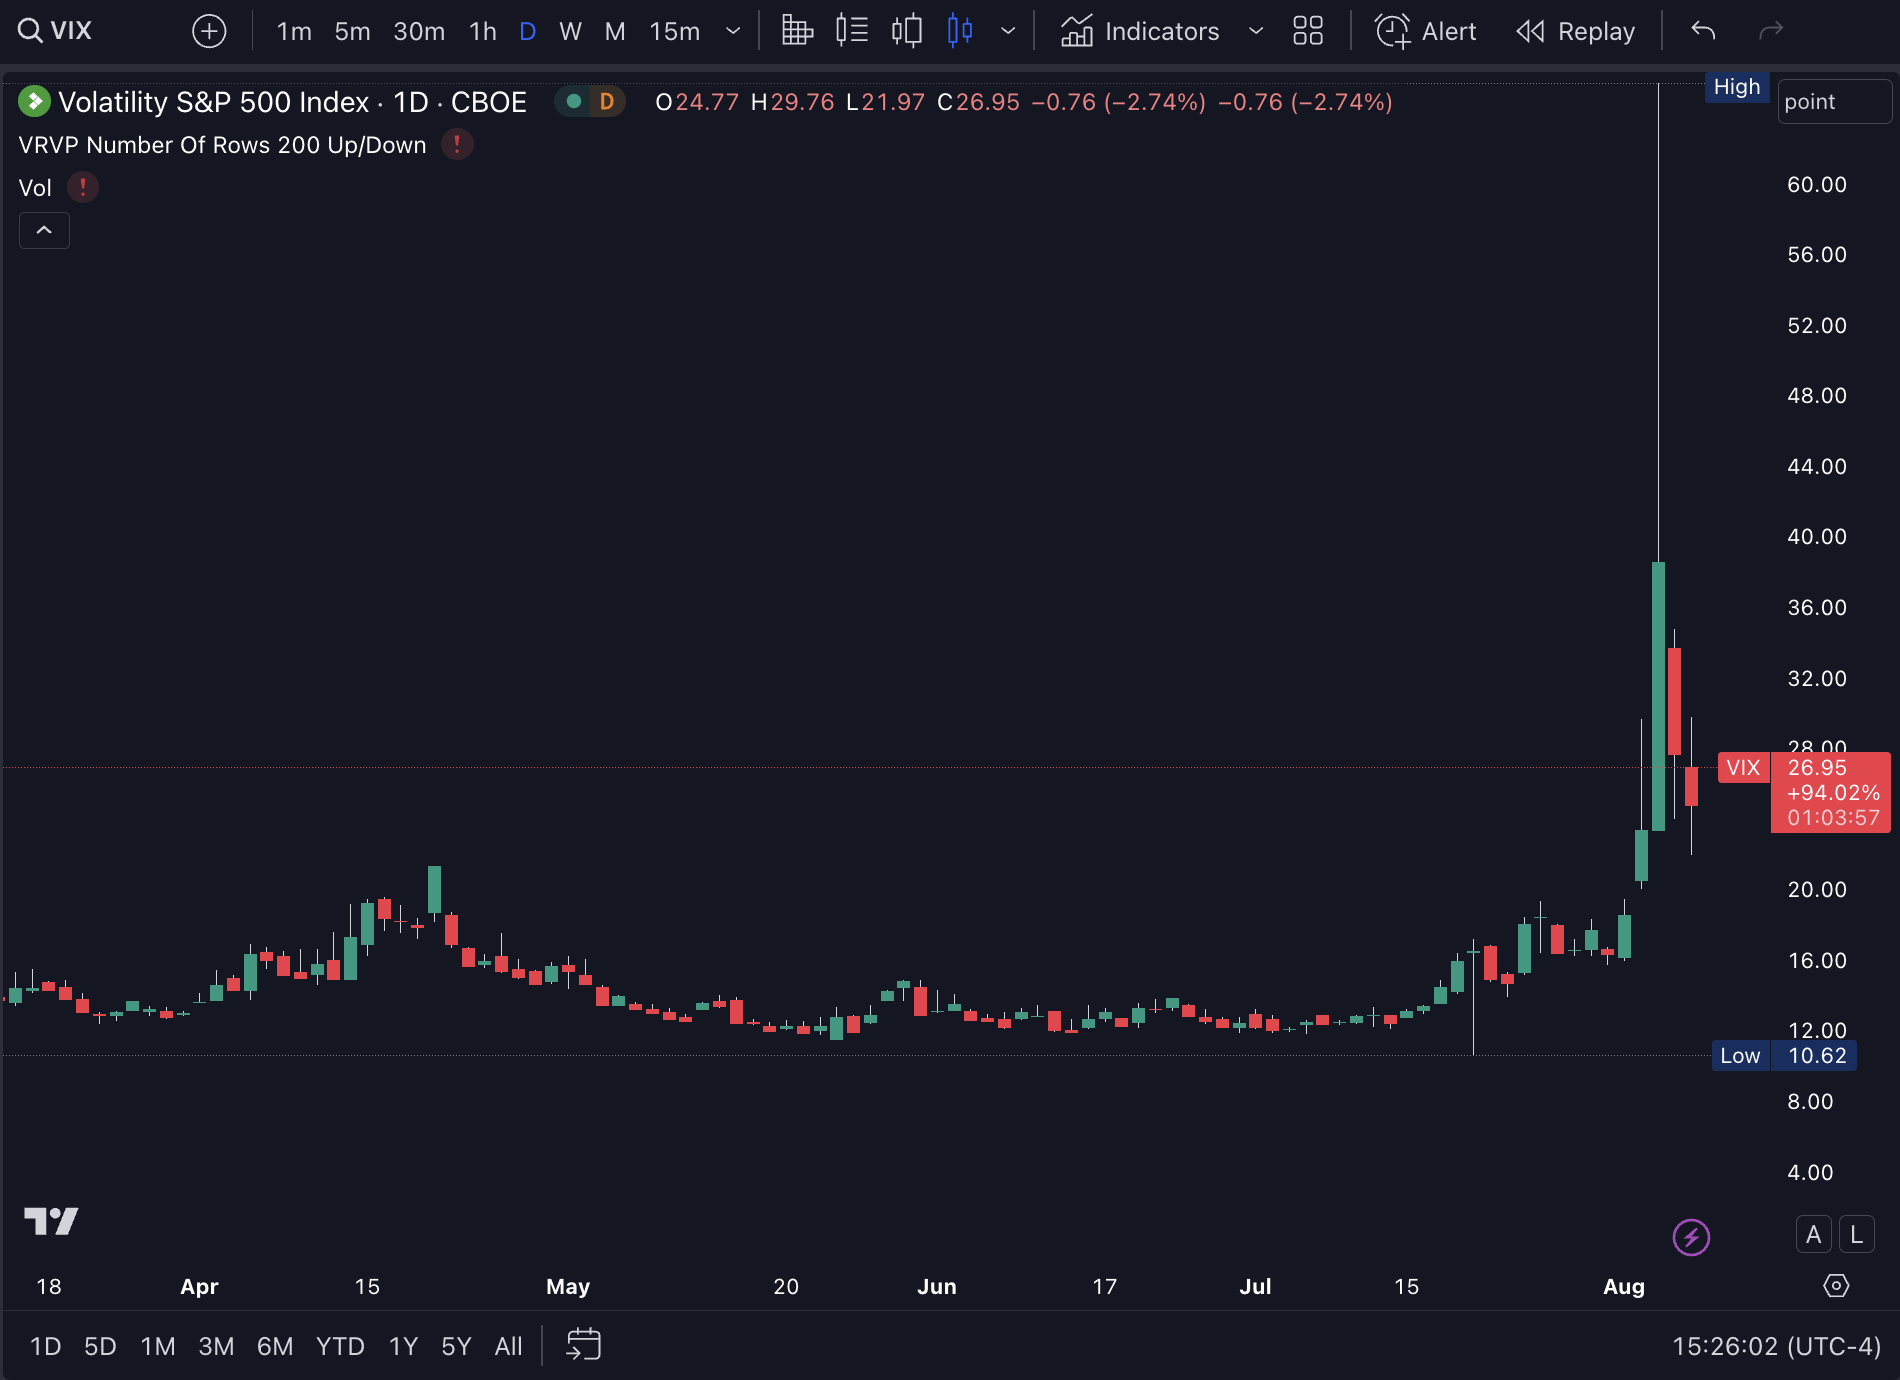
The VIX saw significant price action during the Monday sell-off, briefly spiking above 65 in the morning, up from about 23 on Friday and 17 a week ago, before cooling to around 38.6 by 4 p.m. ET. This spike marked the highest level the VIX had reached since March 2020, following the Federal Reserve's emergency actions during the Covid-19 pandemic. The spike indicated a dramatic increase in market volatility.
The S&P 500 fell approximately 7% from its peak due to sharp declines in recent days, even after a partial rebound on Tuesday. The VIX's 65% leap on Monday was its largest one-day jump in over six years, and at its intraday peak, the index rose 180%, which would have been its biggest increase in at least 20 years. It surpassed the 115% increase from February 5, 2018, a day known as Volmageddon when short-volatility exchange-traded products significantly impacted the broader market.
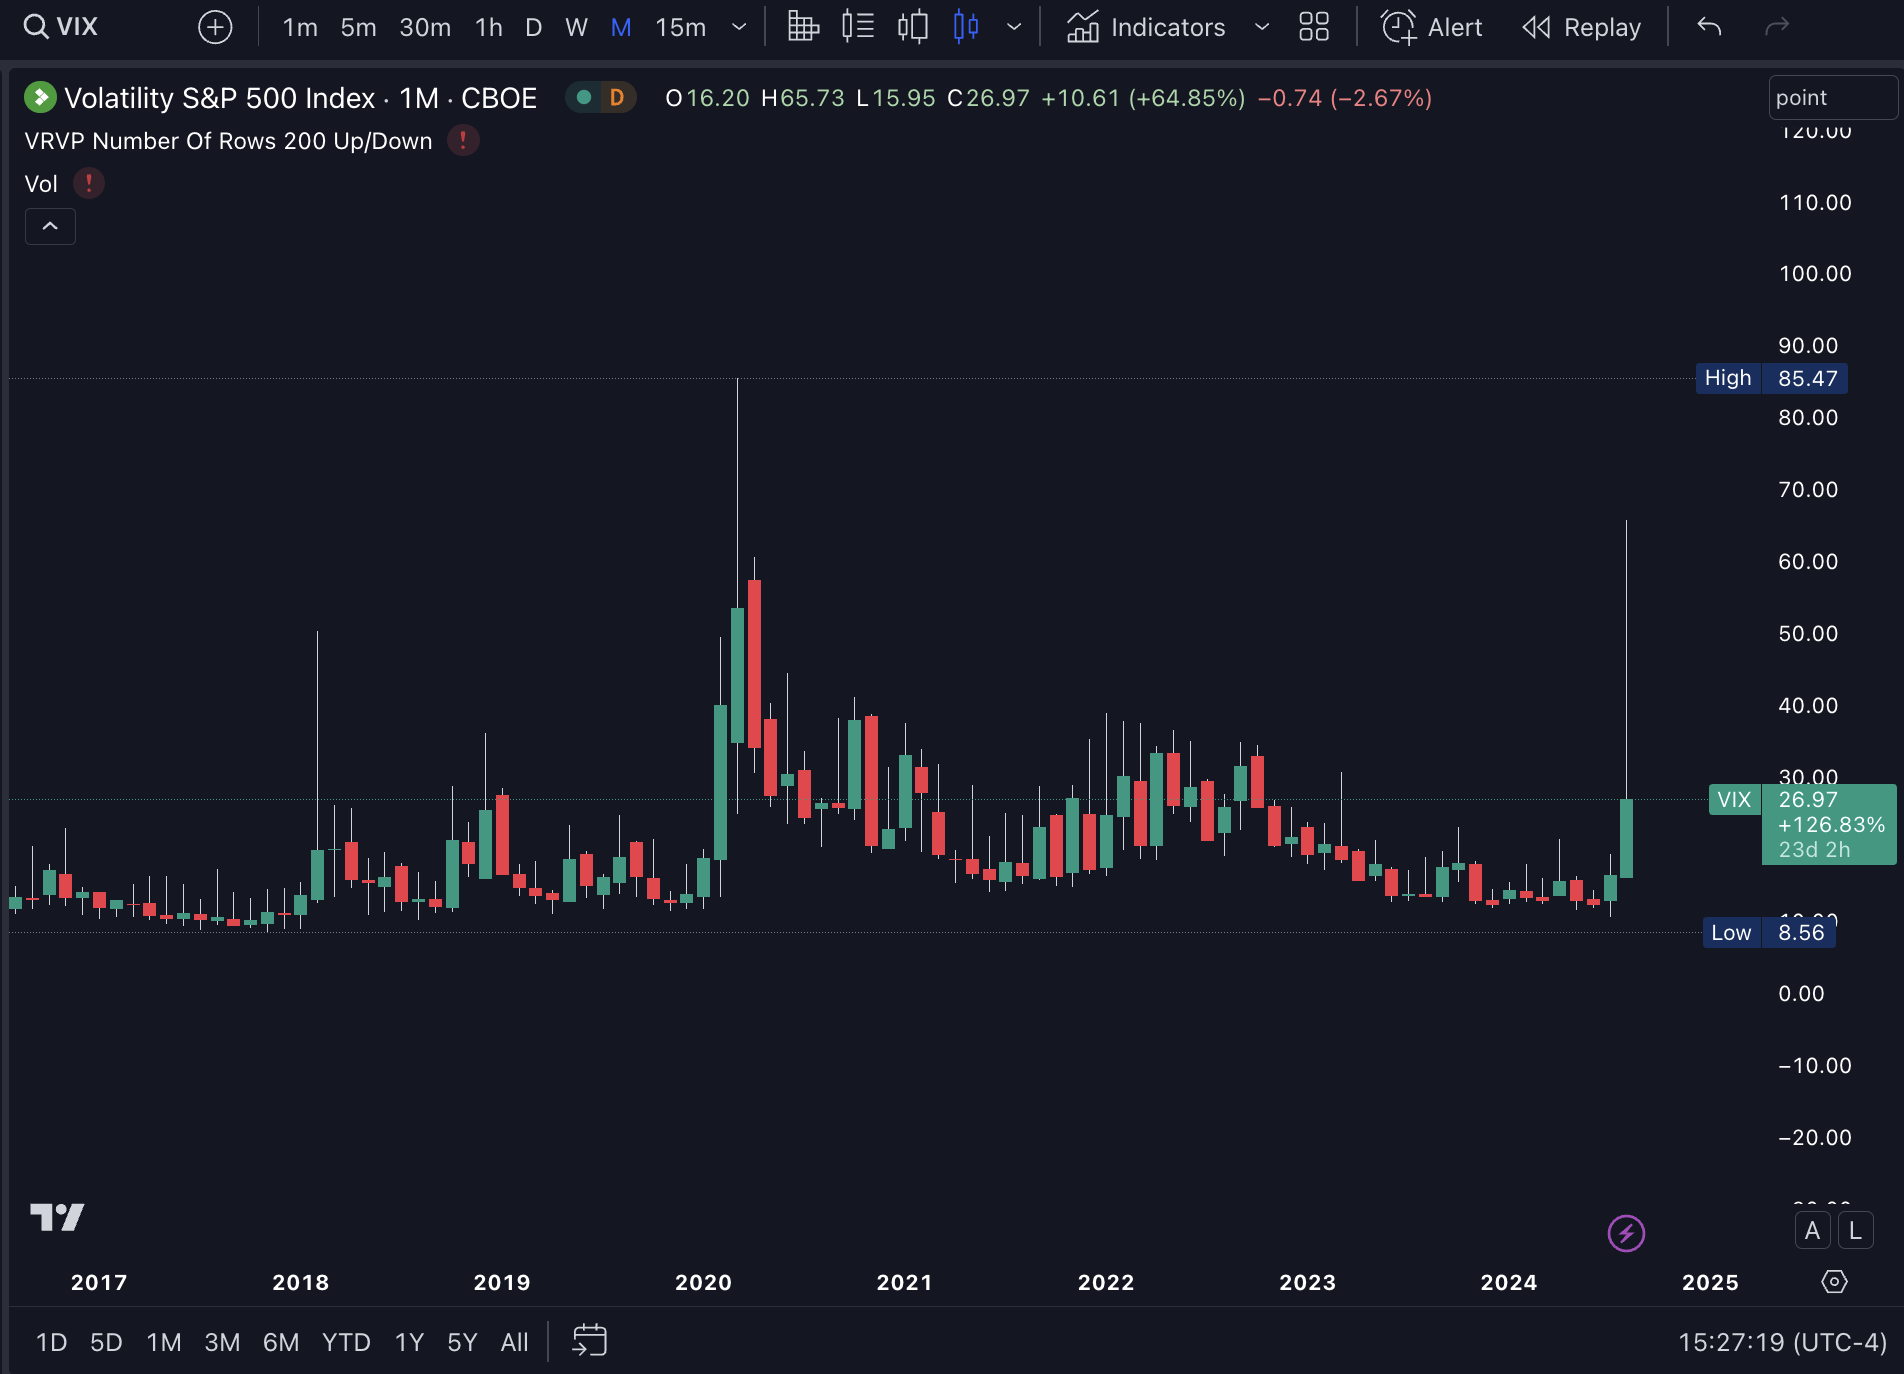
In the early morning, the VIX reached 65.73, the third highest level since records began in 1992, following spikes during the 2008 global financial crisis and the 2020 Covid-19 crash. The VIX calmed down by the afternoon, rising 84% to 43, still marking its highest close since April 2020.
The VIX saw the largest-ever difference between its intraday high and closing values, with its peak also being a record when compared to the maximum actual volatility of the S&P 500 during the day. This significant decoupling indicates that options are driving market movements more than the underlying S&P 500 stocks.
Options trading tied to the VIX hit a six-year high on Friday, and three-month implied volatility surpassed one-year volatility expectations for the first time since the banking crisis of March 2023.
What the VIX Move Means for Equities
While Friday's sell-off lacked significant panic, the VIX's spike above 60 on Monday came without any additional fundamental news. Such spikes often align with deep market sell-offs but can be short-lived and precede stock rebounds.
Monday's initial surge likely reflected traders adding protection or shifting from short-term to longer-term options amid unmet market demand. Although some blame the stock sell-off on the Yen carry trade, the short volatility trade is seen as a bigger factor.
The CBOE VIX index serves as a hedge against sudden downturns, but when investors are positioned for low volatility, reversals can be more severe. People were willing to pay ridiculously high prices to protect short-term activity. This was an entirely different mode from a couple of days earlier.
Higher volatility is forcing hedge funds and other investors to unwind even profitable trades to cut risk levels, leading to exaggerated price moves across various assets. Risk management teams are compelling traders to unwind both losing and profitable trades, causing unusual market movements. This is what traders look for in terms of capitulation.
During a brief period, the spread between the spot VIX and its second-month futures contract reached a deeply negative 30 points, surpassing the lows seen during the COVID-19 selloff. On a closing basis, this would have been the widest level since October 2008, indicating significant demand for immediate protection, as investors were panicking and paying up to guard against further losses. Typically, stock market corrections don't bottom until this spread inverts by at least 10 basis points. After the market opened, the spread cooled to negative 15, suggesting that while signs of panic are often consistent with the end of a selloff, there remains a risk of further declines.
There are signs that some investors expect volatility to sink again. Data from Cboe Global Markets showed near-record trading in VIX-related options on Friday, particularly in put contracts, indicating expectations of a VIX decline.
Conclusion
The jump in the VIX highlights a mix of cautious optimism and concerns for market participants. Some investors view the high VIX as an indication that equities are becoming more attractive, suggesting that despite potential short-term losses, the risk-reward profile for U.S. equities is improving. This belief is underpinned by a base case of a soft landing for the economy, with emerging contrarian bullish signals. The current stock market volatility appears to stem more from the unwinding of speculative trades rather than a fundamental economic issue.
Historical data from Bespoke Investment Group shows that rapid selloffs, like the recent 8.5% decline in the S&P 500 over 14 days, often lead to positive returns in the subsequent weeks and months, similar to rebounds seen after past market shocks such as Black Monday in 1987 and the 1998 Russian crisis.
However, caution is warranted due to the complex market dynamics at play. Historical patterns indicate that volatility spikes, such as the recent one, tend to lead to a higher trading range for the VIX and a potential second selloff within the next 30 trading days, as seen during the volpocalypse in February 2018.
Additionally, data from the Commodity Futures Trading Commission suggests that there may still be bets against the VIX that need to be unwound, which could further impact market stability. The return of volatility may affect capital markets activity, including IPOs and bond deals, making it crucial for investors to remain vigilant and prepared for further market fluctuations.
The action comes ahead of a seasonally weak period for the markets and during heightened geopolitical tensions. Investors would be wise to exhibit caution and be prepared to trade both sides of the tape.
VIX Trading Instruments
Here are five ETFs for both long and short positions on the VIX, along with details on average daily volume, assets under management (AUM), and expense ratios:
Long VIX ETFs
1. iPath Series B S&P 500 VIX Short-Term Futures ETN (VXX)
- Average Daily Volume: Approximately 39.3 million shares
- AUM: $797.3 million
- Expense Ratio: 0.89%
2. ProShares VIX Short-Term Futures ETF (VIXY)
- Average Daily Volume: Around 5.3 million shares
- AUM: $407.2 million
- Expense Ratio: 0.85%
3. VelocityShares Daily Long VIX Short-Term ETN (VIIX)
- Average Daily Volume: About 533,000 shares
- AUM: $43.9 million
- Expense Ratio: 0.89%
4. ProShares Ultra VIX Short-Term Futures ETF (UVXY)
- Average Daily Volume: Roughly 27.8 million shares
- AUM: $1.1 billion
- Expense Ratio: 0.95%
5. iPath Series B S&P 500 VIX Mid-Term Futures ETN (VXZ)
- Average Daily Volume: Approximately 255,000 shares
- AUM: $89.4 million
- Expense Ratio: 0.89%
Short VIX ETFs
1. ProShares Short VIX Short-Term Futures ETF (SVXY)
- Average Daily Volume: Around 6.7 million shares
- AUM: $664.5 million
- Expense Ratio: 0.95%
2. VelocityShares Daily Inverse VIX Short-Term ETN (XIVH)
- Average Daily Volume: About 112,000 shares
- AUM: $7.7 million
- Expense Ratio: 1.35%
3. VelocityShares Daily Inverse VIX Medium-Term ETN (ZIV)
- Average Daily Volume: Roughly 67,000 shares
- AUM: $49.3 million
- Expense Ratio: 1.35%
4. ProShares UltraShort VIX Short-Term Futures ETF (SVXY)
- Average Daily Volume: Around 6.7 million shares (same as SVXY)
- AUM: $664.5 million (same as SVXY)
- Expense Ratio: 0.95% (same as SVXY)
5. Dynamic Short Short-Term Volatility Futures ETF (WEIX)
- Average Daily Volume: Approximately 2,591 shares
- AUM: N/A (new fund)
- Expense Ratio: 0.50%
These ETFs provide various options for traders looking to take either long or short positions on the VIX, catering to different investment strategies and risk appetites. The differences in daily volumes, AUM, and expense ratios highlight the diversity in liquidity and cost structures among these ETFs.
Independent investment research powered by a team of market strategists with 20+ years of Wall Street and global macro experience. We uncover high-conviction opportunities across equities, metals, and options through disciplined, data-driven analysis.
Latest Articles
Unlock Market-Moving Insights.
Subscribe to PRO Articles.
Already have an account? Sign in
Unlock Market-Moving Insights.
Subscribe to PRO Articles.
Already have an account? Sign in
Stay ahead of the market.
Get curated U.S. market news, insights and key dates delivered to your inbox.
