
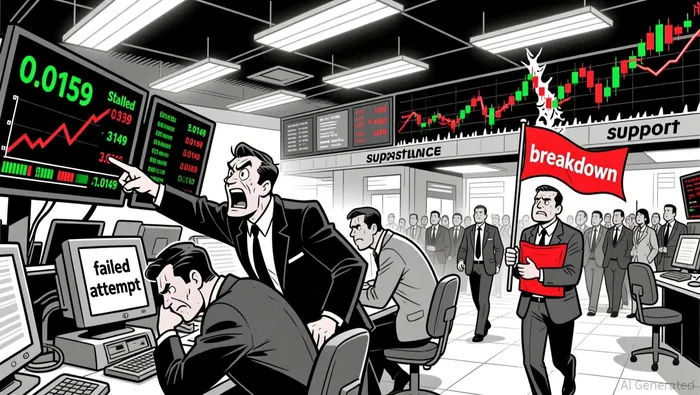
DODOUSDT Breaks Key Support Amid Surging Bear Volume
Summary
• DODOUSDT consolidated between 0.0157–0.0159 before declining to 0.0144 by 12:00 ET.
• Momentum weakened as RSI and MACD showed bearish divergence after midday.
• Volatility expanded during the decline, with Bollinger Bands widening post 04:00 ET.
• Volume increased during bearish moves, confirming price declines in the final 6 hours.
• A bullish engulfing pattern failed to hold near 0.0159, reinforcing bearish pressure.
DODOUSDT opened at 0.0157 on 2026-02-21 12:00 ET, peaked at 0.0159, and closed at 0.0144 on 2026-02-22 12:00 ET, with a 24-hour volume of 21,641,293.8 and turnover of 345,879.89. Price fell amid rising volume and declining momentum, with bears gaining control from early morning.
Structure & Formations
DODOUSDT found resistance at 0.0159 during early ET hours, where multiple failed bullish attempts signaled weakening momentum. A key support level emerged near 0.0156, but it broke decisively after 04:00 ET. The price then continued to retest lower levels, with 0.0148–0.0149 appearing as a potential short-term floor.
 A large bearish candle formed during the 05:30–06:00 ET window, signaling a shift in control.
Moving Averages and MACD/RSI
Short-term 20/50-period moving averages on the 5-minute chart crossed bearish around 03:30 ET, reinforcing a downtrend. RSI entered oversold territory near 0.0144 by 12:00 ET, suggesting potential for a rebound, but divergence between price and momentum indicates caution. The MACD showed bearish divergence from 04:30 ET onward, with negative momentum persisting.
Bollinger Bands and Volatility
Volatility expanded from 03:00 ET onward as Bollinger Bands widened, reflecting increased uncertainty. Price traded near the lower band during the final 6 hours, indicating bearish dominance. The contraction in bands earlier in the session hinted at a possible breakout, which materialized in a bearish direction.
Volume and Turnover
Volume surged during bearish moves, particularly in the 04:00–06:00 ET period, confirming the downward trend. Turnover aligned with price action, showing no divergence. The largest volume spike occurred around 07:15 ET when price was consolidating near 0.0151, indicating increased activity during a critical support test.
Fibonacci Retracements
A key 61.8% retracement level from the 0.0157–0.0159 range was tested at 0.0156, but failed to hold. Price continued lower, aligning with the 78.6% Fibonacci level near 0.0149. The breakdown below 0.0149 suggested that deeper Fibonacci levels (88.6%) at ~0.0145 could become relevant in the next 24 hours.
Over the next 24 hours, a test of the 0.0144–0.0145 range could trigger a short-term bounce if RSI shows a reversal. However, bears may remain in control if volume declines with higher prices, limiting upside potential. Investors should watch for a break below 0.0144 as a signal of continued downside.
Decoding market patterns and unlocking profitable trading strategies in the crypto space
Latest Articles
Stay ahead of the market.
Get curated U.S. market news, insights and key dates delivered to your inbox.


AInvest
PRO
AInvest
PRO
Comments
No comments yet