
Disney's Six-Day Rally Hits the Wall Buyers Built in June
 Aime Summary
Disney rallied for six straight sessions after its Q3 earnings report, climbing roughly 9% over the preceding six sessions from the low $90s into the $110 range. Today, the streak snapped. DISDIS-- fell 1.5% to close at $109.63 on Friday, August 26 — right into a zone where institutional sellers had piled up all summer long.
The technical setup is no longer an easy breakout. It's a test. And the money flow today tells the story.
The rally's engine — and its new drag
Disney's run started on August 5, when adjusted EPS of $2.06 beat the consensus estimate of $1.88 by 9.6%. Streaming operating income more than doubled to $712 million from $329 million a year earlier, and Experiences posted record Q3 revenue of $10 billion. Shares climbed 3.7% to about $101.76 and kept climbing.

But today's capital flow data, as of 4:24 PM ET, reveals a shift in who's trading. Large institutional orders — the orders big enough to move a stock Disney's size — showed net outflow. Sellers deployed $12.75 million in large sell orders against only $8.03 million in large buys. Block trades were roughly even, but retail flows tilted negative too, with $28.3 million in retail selling against $24.4 million in buying.
Price goes up when buyers outnumber sellers at higher prices. Today, the stock that just finished its hottest week in months was met by larger sell orders than buy orders. That doesn't mean the thesis is broken. It means the rally is running into real supply, not thin air.
The level that separates relief rally from trend
The 200-day simple moving average sits at $104.09. DisneyDIS-- closed above it on August 5 and hasn't looked back. The 50-day SMA, at $100.45, is now well below price and rising. RSI-14 sits at 65.2 — elevated but not yet overbought. MACD is positive at 2.90, confirming momentum is on the bullish side.
These indicators don't make the case. Price does.
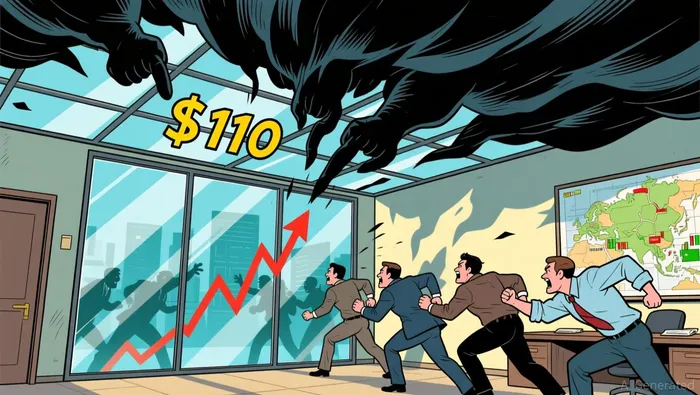
The $110-$112 zone is the ceiling. Disney closed near $111.25 yesterday and today's high was $111.52 before sellers took over. This is the same range where the stock struggled in late June and early July. Multiple failed attempts to close above this level mean a dense order book of sellers who bought earlier and are now near breakeven. A breakout here doesn't need conviction from new buyers alone — it needs existing sellers to surrender.
The average true range over 14 days is $2.33. Today's intraday volatility of 1.9% was below normal. Low-volatility pullbacks into resistance are the kind of sessions where supply quietly accumulates. They don't look alarming until the next day's open tests whether that supply held.
What the higher timeframe says
Disney's 52-week range stretches from $92.19 to $119.78. At $109.63, the stock is sitting roughly in the middle — but it's middle after a decisive move up from the lower third. The P/E ratio has expanded to 19.8x from 14.5x in the prior quarter as price has caught up to the improving fundamentals.
That re-rating is meaningful. A stock earning $92 a share on a trailing basis that trades at $96 commands a single-digit multiple. The same stock at $110, on the same earnings, trades like a mature compounder. The six-day rally didn't just lift price — it lifted the multiple. That expansion can sustain itself if earnings keep accelerating. It can reverse just as fast if the next data point stalls.
The map
Everything now runs through two levels.
Support at $104: The 200-day moving average, which the stock reclaimed on the earnings day. If a pullback returns here, the question is whether buyers treat it as a value zone or whether the breakout itself loses credibility. A daily close below $104 and the six-day rally becomes a dead-cat bounce inside a broader range.
Resistance at $111.50: Today's high and the edge of the prior rejection zone. A sustained break above this — on a day when large-order inflow exceeds outflow — opens a measured path toward the 52-week high near $120. That's roughly 9% from here. Below $111.50 and this is a consolidation, not a breakout.
| Scenario | Trigger | Path | Invalidation | Horizon |
|---|---|---|---|---|
| Breakout confirmed | Close above $111.50 with large-order inflow | Toward $115-$120 (52-week high) | Daily close back below $109 | 2-4 weeks |
| Consolidation | Bounces off $104, can't break $111.50 | $104-$112 range-bound | Break above $111.50 or below $104 | 1-3 weeks |
| Breakout failure | Daily close below $104 | Toward $97-$92 (52-week low) | Reclaim above $108 | 1-2 weeks |
The verdict
Hold $104 and the rally — and the story behind it — remains in play. Lose $104 and the six-day run was a relief move that ran into the same supply it couldn't crack in June.
Disney's fundamentals improved. Streaming is profitable. Parks are printing record revenue. But the chart doesn't care about fundamentals the way the headline does. It cares about who holds inventory at what price, and whether the next session's buyers are bigger than the sellers sitting at breakeven.
The next open decides.

Stay ahead of the market.
Get curated U.S. market news, insights and key dates delivered to your inbox.


AInvest
PRO
AInvest
PRO




Comments
No comments yet