
Deutsche Bank Surges 3.16% as Technical Indicators Bolster Bullish Momentum with Key Support Tested
Deutsche Bank (DB) closed the most recent session with a 3.16% gain, marking a notable reversal in a context of recent volatility. This price action, combined with the historical data, provides a robust foundation for a multi-faceted technical analysis. The following insights are derived from key technical frameworks, emphasizing confluence and divergence points across indicators.
Candlestick Theory 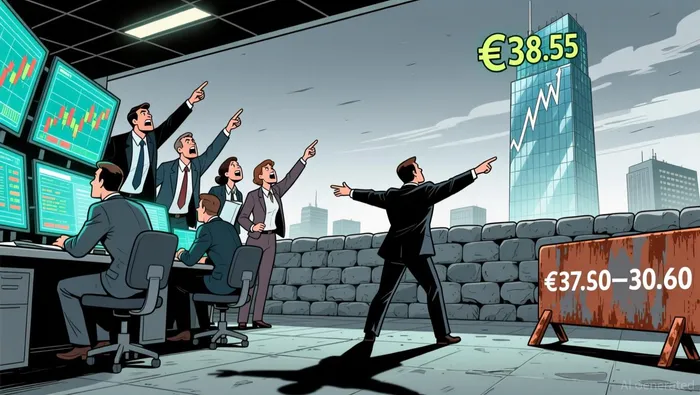 This aligns with a critical support level identified at ~€35.90–36.20, where previous bounces occurred (e.g., 2025-11-04 and 2025-11-05). Resistance levels are evident at €37.30–37.60, with the 2025-12-11 peak at €38.55 acting as a distant overhead barrier. The current price action implies a test of these levels, with the potential for a continuation of the upward trend if the €38.22 level holds.
Moving Average Theory
The 50-day moving average (~€35.50) currently supports the price, while the 100-day (~€35.10) and 200-day (~€34.70) averages lag behind, indicating a short-term bullish bias against a longer-term consolidation phase. The price crossing above the 50-day MA on 2025-12-18 reinforces this divergence, suggesting a potential short-term uptrend. However, the 200-day MA remains a critical threshold; a sustained close above this level may signal a broader trend reversal.
MACD & KDJ Indicators
The MACD histogram has turned positive, with the line crossing above the signal line, indicating strengthening bullish momentum. The KDJ indicator (stochastic oscillator) shows a steeper %K line rising above %D, suggesting a potential overbought condition as the %K approaches 80. While this may hint at short-term exhaustion, the alignment with the MACD’s bullish signal increases the probability of a continuation. A divergence between price highs and KDJ peaks, however, would caution against overreliance on this signal.
Bollinger Bands
Volatility has expanded recently, with the bands widening from a narrow range observed in late November. The current price (~€38.22) sits near the upper band, a zone typically associated with overbought conditions. This position, combined with the recent contraction in volatility prior to the breakout, supports the likelihood of a continuation in the short term. A retest of the lower band (~€35.80–36.00) could validate the trend’s sustainability.
Volume-Price Relationship
Trading volume surged to 2.899 million shares on the 3.16% gain, a 30% increase from the prior session’s volume. This surge aligns with the price’s break above the upper Bollinger Band and reinforces the credibility of the bullish move. However, the absence of a corresponding volume spike on previous upward moves (e.g., 2025-11-11) raises questions about the sustainability of the current rally. A follow-through increase in volume on subsequent up days would be necessary to confirm strength.
Relative Strength Index (RSI)
The 14-day RSI has crossed into overbought territory (>70), a condition that historically precedes pullbacks. While this does not guarantee a reversal, it highlights a heightened risk of near-term profit-taking. The RSI’s alignment with the MACD’s bullish signal creates a confluence suggesting a continuation of the uptrend, albeit with caution for a potential correction if the RSI fails to form higher highs.
Fibonacci Retracement
Key Fibonacci levels from the 2025-06-05 low (~€25.69) to the 2025-08-07 high (~€35.79) include 38.2% at ~€33.00 and 61.8% at ~€35.50. The current price (~€38.22) exceeds these levels, indicating a potential extension phase. A retest of the 61.8% retracement level (~€35.50) could serve as a critical support for trend validity, while a break above the 100% extension (~€37.80) would signal a new bullish impulse.
In summary, Deutsche Bank’s recent price action reflects a strong short-term bullish bias, supported by confluence in candlestick patterns, MACD, and volume dynamics. However, overbought conditions in RSI and KDJ, coupled with potential Fibonacci retracement levels, underscore the need for caution. Divergences between price and momentum indicators could signal a weakening trend, warranting close monitoring of volume and key support/resistance levels.
If I have seen further, it is by standing on the shoulders of giants.
Latest Articles
Stay ahead of the market.
Get curated U.S. market news, insights and key dates delivered to your inbox.
AInvest
PRO
AInvest
PRO
Comments
No comments yet