
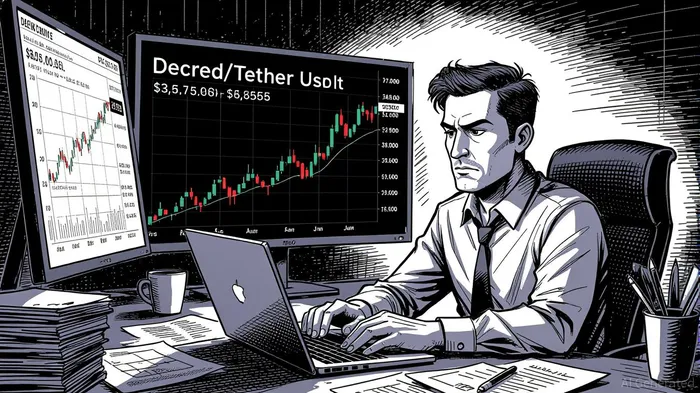
Decred/Tether USDt (DCRUSDT) Market Overview: Bearish Reversal Amid Volatile 24-Hour Range
• Decred/Tether USDt (DCRUSDT) closed lower at $16.33 after forming bearish reversal patterns late in the session.
• Price swung between $16.23 and $16.59, showing moderate volatility with expanding BollingerBINI-- Bands.
• Key resistance at $16.55 and support at $16.29 identified, with volume surging in both zones.
• RSI and MACD showed bearish momentum, suggesting potential for further downward correction.
• Notional turnover increased during the late-ET rebound but failed to confirm a bullish breakout.
DCRUSDT opened at $16.30 on 2025-09-05 12:00 ET, reached a high of $16.59, and a low of $16.23, closing at $16.33 by 2025-09-06 12:00 ET. Total volume for the 24-hour period was 10,715.45 DCR, with a notional turnover of $173,152.54. The asset displayed mixed momentum, forming bearish reversal patterns following an initial upward breakout.
Structure & Formations
Price action revealed a strong bearish reversal pattern in the late ET session, particularly after reaching $16.59. A long upper shadow and bearish close in the final hours indicated rejection at key resistance. Earlier, a bullish engulfing pattern had briefly pushed price above $16.55, but it failed to hold. Key support appears to be forming at $16.29, with a potential secondary level at $16.25. A 61.8% Fibonacci retracement level from the recent high to low resides at $16.35, which may serve as a near-term pivot.
Moving Averages
On the 15-minute chart, the 20-period moving average (SMA) crossed below the 50-period SMA in the late ET session, signaling bearish momentum. On the daily chart, the 50-period SMA is approaching $16.40, a level that may offer resistance if the asset recovers. The 200-period SMA is currently at $16.38, suggesting the market remains in a longer-term consolidation phase.
MACD & RSI
The MACD turned negative in the final hours, confirming the bearish reversal in price. RSI dropped below 50 into oversold territory during the late-ET selloff, but it failed to close above the midline, reinforcing the likelihood of a continuation in the downward trend. The divergence between the RSI and price action during the early rebound suggested weakening bullish conviction.
Bollinger Bands
Bollinger Bands showed a significant expansion during the late-ET volatility, with price breaching the upper band on the way to $16.59 and then collapsing below the lower band in the early-morning hours. The recent contraction of the bands in the 06:00–09:00 ET timeframe suggests a potential for a breakout, though the closing action indicates a bearish outcome is more probable.
Volume & Turnover
Volume spiked during key price levels, particularly at $16.55 and $16.29, suggesting strong participation from institutional or large-cap investors. Turnover mirrored the volume pattern, with a notable divergence during the 04:00–06:00 ET rebound. While volume was strong, the price failed to confirm the bullish breakout, indicating a possible bear trap.
Fibonacci Retracements
Applying Fibonacci levels to the recent 15-minute swing from $16.23 to $16.59, the 61.8% level sits at $16.35 and may serve as an initial target for downward correction. On the daily chart, the 50% retracement from a longer-term range is near $16.40, which could act as a psychological ceiling for the next 24–48 hours.
Backtest Hypothesis
Given the observed reversal patterns and divergences in RSI, a backtest could explore a strategy of shorting DCRUSDT after a bearish engulfing pattern forms near resistance levels, especially when RSI shows oversold divergence. A stop-loss could be placed just above the 61.8% Fibonacci retracement level, while a take-profit target might be set at the 38.2% retracement or the next support zone at $16.25. A trailing stop might be applied if the market begins to show signs of reversal.
Decoding market patterns and unlocking profitable trading strategies in the crypto space
Latest Articles
Stay ahead of the market.
Get curated U.S. market news, insights and key dates delivered to your inbox.


AInvest
PRO
AInvest
PRO
Comments
No comments yet