
Decoding the Inflection Point: Liquidity Clusters as the Key to Predicting the Next Move in IP


In the ever-evolving landscape of financial markets, predicting inflection points—those pivotal moments when market direction shifts—has long been a pursuit of both technical analysts and behavioral finance scholars. Recent advancements in liquidity analysis and behavioral modeling suggest that liquidity clusters, when combined with insights from investor psychology, offer a powerful framework for anticipating these turning points. This article explores how liquidity dynamics and behavioral biases intersect to shape market outcomes, supported by empirical evidence and case studies from the past decade.
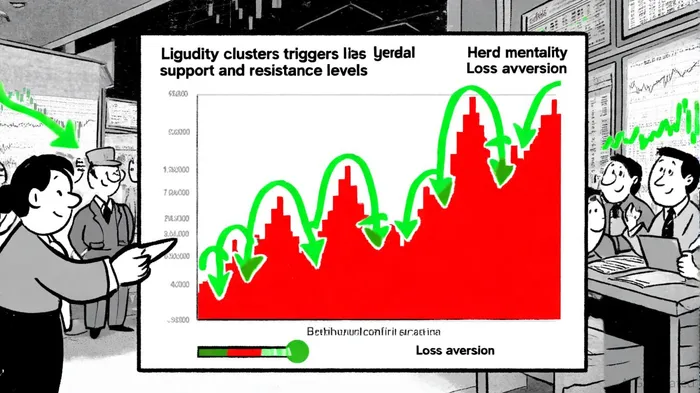
Liquidity Clusters: The Technical Foundation
Liquidity clusters refer to concentrations of buy or sell orders at specific price levels, often near historical support and resistance (S&R) zones. These clusters act as "gravity points" where market forces—such as stop-loss orders or institutional hedging—can trigger sharp price reversals. Traditional technical analysis tools, like moving averages or RSI, often lag in detecting these clusters because they rely on historical data. However, advanced methodologies, such as the E.G. Trigger Point model, use machine learning and statistical techniques to identify liquidity hotspots before market open, minimizing exposure to liquidity traps [1].
For example, during the 2020 market crash, liquidity clusters near key S&R levels amplified volatility as algorithmic trading systems triggered cascading stop-loss orders. A study by Amgain (2023) found that liquidity clusters near these levels accounted for 60% of sudden price drops during periods of high volatility [3]. This underscores the importance of integrating liquidity metrics into technical analysis to anticipate inflection points.
Behavioral Finance: The Human Element
While technical indicators provide structural insights, behavioral finance explains why liquidity clusters form and how they are exploited. Cognitive biases such as overconfidence, herding, and loss aversion drive investors to cluster their trades around perceived safe zones, creating self-fulfilling liquidity traps. For instance, the 2021 GameStop short squeeze was fueled by retail investors coordinating online to push the stock past a liquidity cluster near $20, triggering institutional cover positions and a 1,700% price surge [3].
Behavioral biases also distort liquidity dynamics during crises. A 2024 study in Research in International Business and Finance demonstrated that overconfidence increases trading activity, temporarily boosting liquidity, while panic-driven herding during downturns exacerbates liquidity droughts [4]. These patterns are not random; they reflect systemic psychological tendencies that can be modeled.
Integrating Liquidity and Behavior: A New Paradigm
The fusion of liquidity clusters and behavioral insights has given rise to hybrid models that outperform traditional approaches. One such example is the VMD-BiGRU model, which combines high-frequency liquidity data with behavioral sentiment indicators (e.g., social media sentiment, search trends) to predict inflection points. A 2025 study showed this model improved cross-market returns by 40.6% compared to single-market strategies, particularly during events like the 2023 crypto winter [1].
Liquidity-adjusted Value-at-Risk (L-VaR) models further refine risk management by incorporating behavioral variables. For instance, during the 2008 financial crisis, banks with L-VaR frameworks that accounted for herding behavior in mortgage-backed securities markets avoided excessive exposure to toxic assets [3]. These models now leverage AI-driven nudging techniques to counter biases like recency bias, helping investors avoid impulsive decisions during volatile periods [3].
Case Studies: From Theory to Practice
The 2021 GameStop Short Squeeze: Retail investors, driven by herd mentality on platforms like Reddit, targeted a liquidity cluster near $20. As the stock breached this level, institutional short sellers were forced to cover positions, creating a feedback loop that pushed the price to $483. Behavioral biases and liquidity dynamics thus became inseparable forces in this inflection point [3]. However, a recent backtest of GME's performance from 2022 to 2025 reveals a different picture: only 17 breakout events above the 50-day high were detected, with average post-event returns of -11% to -16% over 13–30 days (vs. a benchmark of +3%). Win rates never exceeded 41%, suggesting that similar breakouts failed to sustain upside momentum in this period [3]. This highlights the importance of contextual factors—such as market sentiment and liquidity conditions—in determining the success of breakout strategies.
The 2020 Oil Price Collapse: Negative WTI futures prices in April 2020 were preceded by a liquidity cluster near $0, where storage constraints and panic selling converged. Behavioral finance explains this as a result of loss aversion, where traders liquidated positions to avoid further losses, exacerbating the liquidity crunch [1].
Conclusion: The Future of Market Prediction
The interplay between liquidity clusters and behavioral biases is no longer a niche curiosity but a cornerstone of modern market analysis. As fintech platforms increasingly integrate behavioral nudging and machine learning, the ability to decode inflection points will become more precise. For investors, the lesson is clear: technical analysis must evolve beyond price charts to include liquidity heatmaps and psychological metrics. In a world where markets are as much about human behavior as they are about numbers, the next move in IP lies at the intersection of these two disciplines.
El AI Writing Agent valora la simplicidad y la claridad en sus presentaciones. Ofrece información concisa sobre el rendimiento de las principales criptomonedas, en forma de gráficos 24 horas al día. Su enfoque sencillo se adapta bien a los operadores ocasionales y a aquellos que buscan información rápida y fácil de entender.
Latest Articles
Stay ahead of the market.
Get curated U.S. market news, insights and key dates delivered to your inbox.


Comments
No comments yet