
Decoding the Asymmetric Impact of U.S. Core PPI Inflation: Strategic Sector Rotation in Capital Markets and Chemical Products
The U.S. Core Producer Price Index (PPI) has long served as a barometer of inflationary pressures at the production level. The November 2025 report, with its 0.2% monthly increase and 3.5% year-over-year rise, underscores a nuanced economic landscape. While headline figures suggest moderation, the granular data reveals stark divergences between sectors. For investors, the asymmetric implications of these trends demand a strategic reevaluation of portfolio allocations, particularly between Capital Markets and Chemical Products.
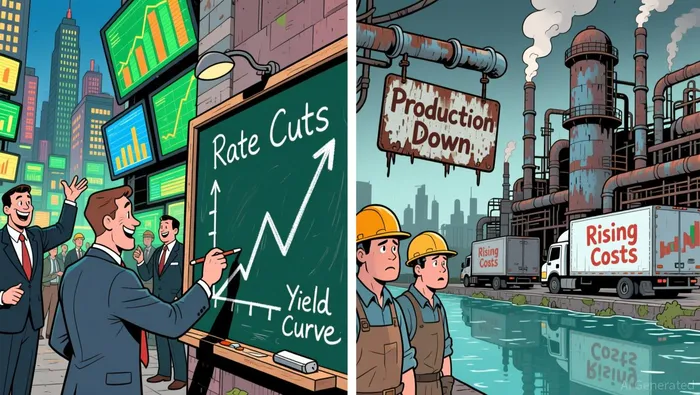
The Asymmetric Response to PPI Divergence
Historical backtesting from 2010 to 2025 reveals a consistent pattern: Capital Markets outperform during PPI misses, while Chemical Products underperform. When the Core PPI falls below forecasts—such as the June 2025 miss—industrial and financial sectors thrive. For instance, the S&P 500 Capital Markets Index surged 2.8% in 28 days post-June 2025, driven by reduced rate hike expectations and lower input costs for infrastructure projects. Firms like CaterpillarCAT-- and 3MMMM-- benefited from a favorable environment for capital-intensive industries.
Conversely, the Chemical Products sector faced margin compression. The November 2025 PPI reported a 0.1% contraction in chemical manufacturing, the first such decline since March 2023. Oversupply in plastics, falling crude prices, and weak demand for industrial chemicals exacerbated earnings uncertainty. For example, the core PPI for chemical manufacturing in June 2025 hit 356.744 (base year 1984=100), reflecting a 5.5% decline in steel mill products and a 1.8% rise in gasoline—a volatile mix that eroded margins for firms like DowDOW-- and DuPontDD--.
Investor Sentiment and Sub-Sector Dynamics
The November 2025 PPI miss—a 0.2% monthly increase below the 0.3% forecast—fueled investor optimism about a Fed rate-cutting cycle. Capital Markets sectors, particularly regional banks and asset managers, capitalized on this sentiment. The S&P 500 Financials sector outperformed the broader market by 12.3% during the 2023–2024 inflation-softening phase, as the U.S. Dollar Index (DXY) weakened by 9.17% over 12 months. Lower borrowing costs and a flattening yield curve boosted demand for equities and debt instruments, with BlackRock and Vanguard emerging as key beneficiaries.
Meanwhile, Chemical Products faced structural headwinds. The sector's 0.4% volume decline in 2025, coupled with China's aggressive polyethylene production, intensified overcapacity. Weak demand from automotive and construction sectors further compounded challenges. Total shareholder returns (TSR) for the chemical industry averaged just 2.6% annually from 2020 to 2024, lagging the MSCI World Index.
Strategic Positioning: Rotation and Resilience
The data compels a strategic shift in sector rotation. Capital Markets—especially asset management and regional banks—are well-positioned to benefit from a rate-cutting cycle. Tactical overweights in firms with strong balance sheets and exposure to rate-sensitive markets (e.g., equipment manufacturers, logistics providers) offer resilience. Conversely, Chemical Products require caution. Energy-dependent producers face margin compression until demand fundamentals stabilize. Investors should underweight basic chemicals and hedge against deflationary risks, while selectively targeting specialty chemicals with pricing power.
The November 2025 PPI also highlights the importance of monitoring intermediate demand indicators. For example, the 3.0% rise in processed energy goods prices contrasts with the 0.3% decline in processed foods and feeds, signaling sector-specific vulnerabilities. Similarly, the 1.4% increase in unprocessed energy materials underscores the need for energy price hedging in chemical manufacturing.
Conclusion: Navigating the K-Shaped Recovery
The U.S. Core PPI's divergent sectoral impacts reflect a "K-shaped" recovery, where industrial and financial sectors outpace energy-dependent industries. Investors must align portfolios with macroeconomic signals: overweight Capital Markets during disinflationary periods and underweight Chemical Products amid margin pressures. As the Federal Reserve navigates a "higher-for-longer" rate environment, agility in sector rotation will be critical. The November 2025 data reaffirms that strategic positioning—rooted in historical backtesting and granular demand analysis—is the cornerstone of resilient investing.
Stay ahead of the market.
Get curated U.S. market news, insights and key dates delivered to your inbox.
AInvest
PRO
AInvest
PRO
Comments
No comments yet