
DBVT Just Put a $4.3 Billion Price Tag on One FDA Decision— The Level That Decides Whether Approval Hopes Re-Price
 Aime Summary
Deck: DBV TechnologiesDBVT-- filed its August 31 share count: 314.4 million shares, a roughly $4.3 billion market value for a company with no approved product and its entire future riding on a single FDA review. The stretch-run rally that followed last year's Phase 3 comeback has already cooled below its 200-day average. One level now separates re-ignition from a deeper fade.
Everything about DBVDBVT-- (NASDAQ: DBVT) right now is a wager on one regulatory outcome. The company's weekly-moving disclosure to the French markets on September 2 puts 314,388,807 shares outstanding as of August 31. Thin the gap between that count and today's price of about $13.56 and you get a market cap north of $4 billion. DBV's lead drug, the Viaskin Peanut patch, has no approval and no product revenue attached to it. What shareholders are buying is a claim on one question: does the FDA say yes.

That is the whole interesting tension here. A small clinical-stage biotech sitting on a $4 billion capitalization because of a drug not yet on the market is expected behavior for a binary FDA story. What is less comfortable is where the chart sits while the market waits.
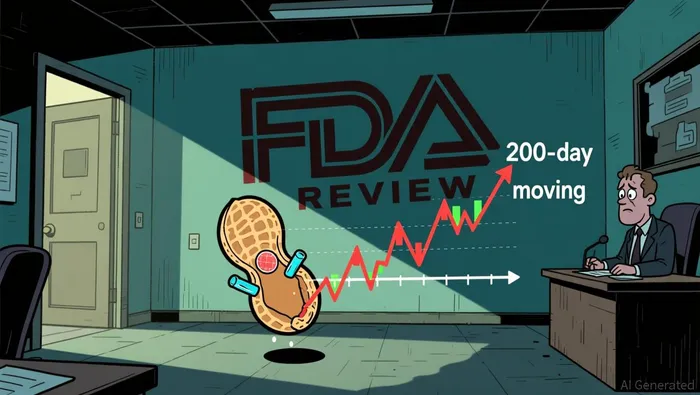
The comeback rally already cooled
Before the levels, the backstory matters, because it explains why DBV trades at all. In August 2020 the FDA rejected the patch. Five years later, in December 2025, the company posted positive Phase 3 results from its VITESSE trial in peanut-allergic children aged 4–7: 46.6% of treated patients met the response threshold at 12 months versus 14.8% on placebo, a result that cleared the study's primary endpoint with statistical significance. That was the get-right moment after a half-decade of doubt, and the shares responded by soaring.
The problem is what happened after the headlines. Right now DBVTDBVT-- trades at about $13.56, down a fraction in a thin session — roughly 63,000 shares changing hands by midday Wednesday. Both of the moving averages that tell regular investors where a stock sits in its own longer trend are overhead: the 50-day sits near $14.64 and the 200-day near $18.15. A stock trading below its 200-day average is, in plain terms, below the average price its own shareholders have paid over the past year. The FDA optimism that carried the stock has faded while the actual application still sits in the pipeline.
The market is not panicking; it is marking time. After a run that already repriced a successful phase 3 trial, the next catalyst that can move DBVT is not a new data point — it is the formal Biologics License Application (BLA) filing that starts the FDA review clock, plus the priority-review and PDUFA decision date that follows.
The clock inside the capital structure
The share disclosure is the reminder of how the bet is paid for. DBV is a company with no marketed product and a real burn: a $98.0 million net loss across the first half of 2026, on $174.9 million of cash at June 30 that management says funds operations into the third quarter of 2027. With the BLA submission shifted to the third quarter of 2026, the runway was sized to carry the company through the regulatory process — but the shareholder base that has to pay for it now numbers 314.4 million shares. Every funding round that keeps the patch alive, in other words, keeps dividing the ownership of the eventual payoff. More shares for the same drug is dilution, the hidden cost of a clinical-stage story.
That is what makes the pricing here so pointed. A 314-million-share count at roughly $13.56 implies the market already assigns meaningful value to approval. The stock is not cheap "if the drug works" — it is priced as if the drug probably works, with the FDA decision still ahead.
The line that decides the map
So the chart's question is not whether approval is likely; it is whether the current level represents the cooled bottom of a pullback or the first step of a longer fade while the clock ticks down to a filing.
The level that matters is the 50-day average at about $14.64. That is the nearest overhead supply, the first zone the stock must reclaim to signal that buyers are stepping back in ahead of the filing. Below it, the stock drifts — and beneath today's low near $13.44, the chart has no clean, well-tested shelf to point at, which is exactly the kind of thin air that makes a biotech pullback fast when it turns.
| Scenario | Trigger | Path | Invalidation | Horizon |
|---|---|---|---|---|
| Re-ignition | Reclaim and hold $14.64 on expanding volume | Push toward $18.15 (200-day) as approval odds re-price | Slip back below $13.44 | Weeks to the filing |
| Fade | Failed bounce below $14.64, break of $13.44 | No firm support until much lower; drift until a PDUFA date lands | Quarterly loss of the trend entirely | Until filing/PDUFA |
| Catalyst spike | BLA submission confirmed in Q3 2026, priority review + PDUFA date set | Sharp re-rate that can leave the moving averages behind | Filing delayed again | Event-driven |
The asymmetry of this setup is worth spelling out because it is not friendly. On the upside, the stock needs to reclaim two exhausted moving averages and the market's approval, in sequence. On the downside, support is thin just below. The one thing that can change the whole map quickly is the filing clock: a confirmed BLA submission and a PDUFA date converts an open-ended "maybe" into a dated binary event that traders can actually price.
Here is the verdict in one sentence. Hold $14.64 on real volume and the approval story gets its next leg, with $18.15 as the first serious ceiling; lose $13.44 before the filing lands and the market has already moved the risk from "when approval happens" to "whether it happens." Right now, with the shares sitting below both averages on whisper-thin volume, the chart is telling you the easy money was already made off the Phase 3 print — and the next real trade only starts when the clock starts.
Prices and technical levels are intraday as of midday ET, September 3, 2026. DBV Technologies is a clinical-stage company; its shares swing on FDA news and funding decisions, and no scenario map is a promise of where the stock will trade.

Stay ahead of the market.
Get curated U.S. market news, insights and key dates delivered to your inbox.


AInvest
PRO
AInvest
PRO




Comments
No comments yet