
CYBERUSDT Consolidates: Volume Spikes Fail to Spark Momentum
Summary
- CYBERUSDT trades near support at 0.3008 after a recent bullish engulfing rejection.
- Volume remains below the 7-day average, indicating weak participation in current moves.
- Market structure is range-bound with price consolidating between 0.2999 and 0.3052.
- High volume spikes failed to sustain directional momentum, suggesting indecision.
- Next 24h outlook favors sideways action unless 0.2999 breaks decisively.
Sideways Consolidation
CYBERUSDT closed the latest 1-hour candle at 0.3025. The 24-hour total volume was approximately 13,500 units. The asset is currently trading within a tight consolidation range.
1-Hour Support/Resistance and Candlestick Patterns
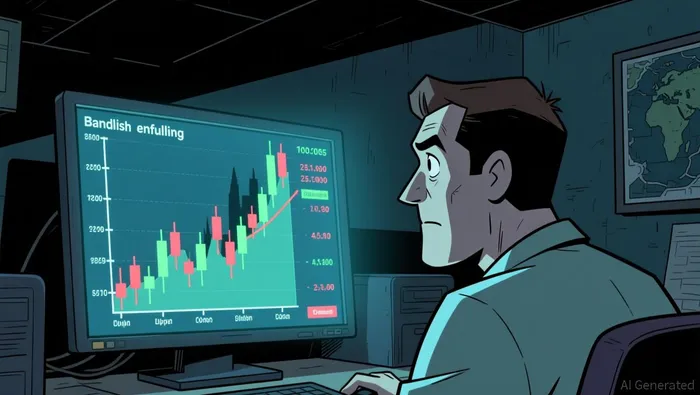
The price action identifies a clear support zone near 0.2999 and resistance near 0.3052. On August 4 at 10:00, the price dipped to 0.2999, establishing a low that acted as immediate support. Another test occurred near 0.3018 during the 06:00 hour, reinforcing the lower boundary. Conversely, resistance was observed at 0.3052 during the 21:00 candle on August 3, where the price failed to sustain higher levels. Candlestick analysis reveals a bullish engulfing pattern at 21:00 on August 3 and again at 06:00 on August 4, suggesting temporary buying interest at lows. Additionally, a long upper shadow appeared at 07:00 on August 4, indicating rejection of higher prices. The current price of 0.3025 is positioned closer to the support level of 0.2999 than the resistance at 0.3052, implying that sellers may have slight near-term control.
Volume and Turnover vs. Historical Comparison
The 24-hour trading volume for CYBERUSDTCYBER-- is significantly lower than the 15-day average daily volume of 13,853.81 and the 7-day average of 11,243.83. The average single-hour volume over the past 7 days is 468.49. The most notable volume spike occurred at 20:00 on August 3, with 7,723.03 units traded. This volume was substantially higher than the 7-day hourly average, exceeding it by more than 16 times. Following this spike, the price moved from 0.3031 to 0.3020 in the same hour, and then recovered to 0.3051 in the subsequent hour. However, the immediate 3-6 hour follow-through was mixed, with the price eventually drifting back down to 0.3025. Other volume spikes, such as the 6,863.16 units at 08:00 on August 2, also failed to produce sustained directional momentum. The current low volume suggests that the recent price stability is driven by a lack of conviction rather than strong accumulation or distribution. The volume anomalies do not appear to have effectively driven a lasting price change.
Look Back: Current Market Phase
The 15-day daily price range is approximately 5%, which is well within the 10% thresholdT-- for a sideways market. The 7-day price change is a modest 0.49%, and the 3-day change is 1.30%. These metrics indicate a lack of strong trending momentum. The market structure feature is explicitly defined as range bound. There are no clear lower highs and lows to suggest a downtrend, nor higher highs and lows for an uptrend. The price is oscillating within a defined channel without breaking out. Therefore, the current market phase is best described as a sideways consolidation. This phase suggests that the market is accumulating energy or waiting for external catalysts to determine the next significant directional move.
The market appears likely to continue consolidating within the 0.2999 to 0.3052 range over the next 24 hours. A break below 0.2999 could trigger downside risk toward 0.2960, while a break above 0.3052 may offer upside potential toward 0.3100.

Decoding market patterns and unlocking profitable trading strategies in the crypto space
Latest Articles
Stay ahead of the market.
Get curated U.S. market news, insights and key dates delivered to your inbox.


AInvest
PRO
AInvest
PRO




Comments
No comments yet