
CVS Health Plunges 5.01% Amid Sustained Bearish Momentum
Generated by AI AgentAinvest Technical Radar
Friday, Jul 25, 2025 6:31 pm ET2min read
CVS-- Aime Summary
CVS Health concluded the most recent session with a significant 5.01% decline to $58.75, reflecting sustained bearish momentum. The comprehensive technical assessment based on the provided dataset follows:
Candlestick Theory
Recent price action reveals a clear bearish trajectory. The sharp decline on 2025-07-24 formed a long-bodied red candle closing near its low ($58.75), following multiple sessions of lower highs and lower lows. This pattern signifies persistent selling pressure. Immediate resistance is established at $61.65 (intraday high of 07-24), with secondary resistance at $62.55 (07-21 high). Critical support rests at $58.50 (07-24 low), with a breach potentially accelerating declines toward the $55 psychological level last tested in early 2025.
Moving Average Theory
The stock trades below all key moving averages (50-day, 100-day, 200-day), confirming a bearish trend structure. Recent price rejections near the 50-day MA illustrate its role as dynamic resistance. The sequence of shorter-term MAs lying below longer-term averages (50 < 100 < 200) signals entrenched downward momentum, with no evidence of trend reversal.
MACD & KDJ Indicators
MACD remains entrenched in negative territory, with the histogram showing expanding downward momentum. KDJ reflects oversold conditions (K and D lines near 20), but the absence of bullish crossover divergence suggests limited reversal potential. Both oscillators align in signaling continued bearish dominance, though deeply oversold KDJ levels may invite short-term consolidation.
Bollinger Bands
Bands have expanded notably during the latest sell-off, reflecting volatility surge. Price piercing the lower band underscores aggressive selling pressure. While such deviations often precede technical bounces, the expanding bandwidth and lack of contraction imply sustained directional momentum. Any rebound would likely face resistance at the middle band (20-day MA).
Volume-Price Relationship
The 5.01% decline on 07-24 occurred on significantly elevated volume (12.44M shares vs. recent average), confirming conviction behind the bearish move. Throughout the downtrend, distribution days have frequently accompanied high volume, validating sustainability of the sell-off. Lack of accumulation volume during minor rebounds further undermines recovery prospects.
Relative Strength Index (RSI)
The RSI has plunged into oversold territory (sub-30), currently reading approximately 28. While this traditionally signals exhaustion, its occurrence within a strong downtrend reduces reliability as a reversal indicator. Notably, prior oversold readings in May 2025 preceded only transient bounces before continuation downward. Current RSI levels suggest heightened downside risk remains.
Fibonacci Retracement
Applying Fibonacci to the major rally from the 2025-01-13 low ($51.52) to the 2025-05-01 peak ($72.51), key retracement levels were breached consecutively. The 61.8% retracement ($59.27) failed as support during the latest decline, shifting focus to the 78.6% level ($55.40). The inability to hold critical Fibonacci thresholds reinforces the bearish structural break.
Confluence & Divergence Observations
Confluence is evident across bearish indicators:
- Price below all MAs with death cross formation
- High-volume breakdown below Fibonacci support
- MACD momentum confirming new lows
- Bollinger Band expansion supporting downside continuation
Notable divergence exists in oversold oscillators (RSI, KDJ) not yet aligning with price action for reversal confirmation. This divergence may precede short-term stabilization but lacks corroboration from volume or candle patterns.
Probabilistic Outlook
CVS Health exhibits unequivocal bearish technical positioning. Oversold oscillator readings and volatility expansion suggest potential near-term consolidation or technical bounce, yet the confluence of resistance layers ($59.27 Fibonacci, $61.65 recent high, descending MAs) and high-volume distribution create formidable recovery barriers. A sustained reversal would require reconquering the $62.55-63.80 resistance zone with accompanying accumulation volume, which appears improbable under current momentum. Downside targets remain focused on the $55.40-56.00 support confluence (78.6% Fibonacci and 2025 swing lows). Traders should monitor for bullish divergence formation or candle reversal patterns to signal exhaustion, though trend continuation remains the dominant technical narrative.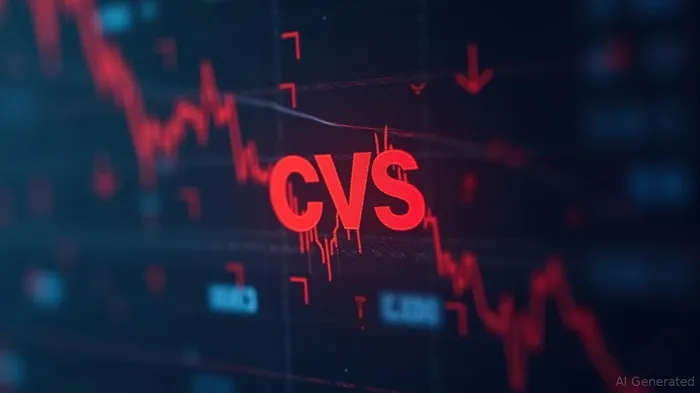
If I have seen further, it is by standing on the shoulders of giants.
Latest Articles
Stay ahead of the market.
Get curated U.S. market news, insights and key dates delivered to your inbox.
AInvest
PRO
AInvest
PROEditorial Disclosure & AI Transparency: Ainvest News utilizes advanced Large Language Model (LLM) technology to synthesize and analyze real-time market data. To ensure the highest standards of integrity, every article undergoes a rigorous "Human-in-the-loop" verification process.
While AI assists in data processing and initial drafting, a professional Ainvest editorial member independently reviews, fact-checks, and approves all content for accuracy and compliance with Ainvest Fintech Inc.’s editorial standards. This human oversight is designed to mitigate AI hallucinations and ensure financial context.
Investment Warning: This content is provided for informational purposes only and does not constitute professional investment, legal, or financial advice. Markets involve inherent risks. Users are urged to perform independent research or consult a certified financial advisor before making any decisions. Ainvest Fintech Inc. disclaims all liability for actions taken based on this information. Found an error?Report an Issue

ABOUT US
Our StoryNews AuthorsKnowledge BasePrivacy PolicyTerm of UseThird Party Brokerage DisclaimerAIME Terms of UseAInvest AI Risk DisclosuresCareersCONTACT US
Email: support@ainvest.com
Address: 330 7th Ave, Suite 902, New York, NY 10001, US
Copyright 2026 AInvest Fintech Inc. All rights reserved.
Comments
No comments yet