
CTRY Plunges Below $2.25 Amid Surge in Early-Morning Sell-Off
Summary
• Price dropped sharply below $2.32, reaching a 24-hour low of $2.242 before stabilizing near $2.25.
• Volume surged during the early morning hours, coinciding with a steep bearish move.
• RSI approached oversold territory, suggesting a potential short-term bounce may be due.
• Bollinger Bands widened as volatility increased during the decline.
• A key support appears forming around $2.24–$2.25, with resistance at $2.26–$2.27.
Chainbase/Turkish Lira (CTRY) opened at $2.352 on 2026-02-10 at 12:00 ET, reached a high of $2.353 and a low of $2.242, closing at $2.24 at 12:00 ET on 2026-02-11. Total volume for the 24-hour window was 302,877.8, with a notional turnover of $666,547.17.
Structure & Formations
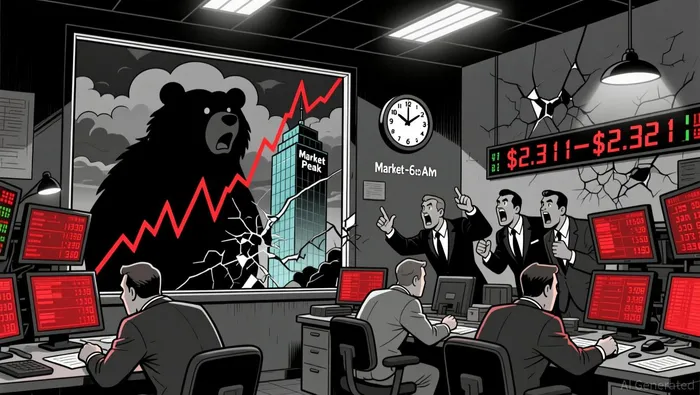
The price action features a sharp bearish breakdown from $2.33 to below $2.27, with a key 5-minute bearish engulfing pattern forming around $2.311–$2.321. A cluster of bearish momentum candles between 03:00 and 06:00 ET indicates strong selling pressure. A potential support base appears forming in the $2.24–$2.25 range, which could offer temporary stability.
Moving Averages
On the 5-minute chart, the price has remained below the 50-period moving average for most of the session, indicating continued bearish bias. The 20-period line has also crossed below the 50-period line, forming a bearish crossover. Daily moving averages are not computed here, but the sharp 24-hour drop suggests a retesting of longer-term support could be near.
MACD & RSI
The MACD line has remained negative throughout the session, with bearish divergence evident in the histogram expansion during the decline. The RSI hit a low of 29.3, nearing oversold territory, suggesting a potential pullback could be due. However, the bearish momentum remains intact, and a rebound may not necessarily signal a reversal.
Bollinger Bands
Bollinger Bands widened as volatility surged during the sell-off, with the price dropping sharply below the lower band in the early morning hours. The expansion suggests heightened uncertainty in the market. As volatility stabilizes, the price appears to be consolidating within a narrower range around the $2.25 level.
Volume & Turnover
Volume surged during the sharp decline, particularly between 04:30 and 06:30 ET, with over 16,000 CTRY traded in key bearish 5-minute periods. Notional turnover also spiked in this range, confirming bearish conviction. Later in the session, volume has decreased, which may indicate waning short-term momentum.
Fibonacci Retracements
The recent 5-minute swing from $2.33 to $2.24 has identified key Fibonacci retracement levels at 23.6% ($2.296), 38.2% ($2.287), 50% ($2.285), and 61.8% ($2.274). The price appears to have stalled near the 61.8% level at $2.274 and has since tested lower levels. A rebound above $2.274 could indicate a short-term recovery, but further consolidation is likely.
The price may find support in the $2.24–$2.25 range in the near term, with a potential bounce into the 61.8% retracement zone possible. However, given the bearish momentum and the depth of the recent sell-off, a continued decline toward $2.22–$2.23 could not be ruled out. Investors should monitor volume patterns and RSI for signs of oversold bounce or further capitulation.
Decoding market patterns and unlocking profitable trading strategies in the crypto space
Latest Articles
Stay ahead of the market.
Get curated U.S. market news, insights and key dates delivered to your inbox.


AInvest
PRO
AInvest
PRO
Comments
No comments yet