
CoreWeave Stock Surges 54% in 4 Days as Technicals Signal Strong Bullish Momentum
Generated by AI AgentAinvest Technical Radar
Wednesday, Jun 4, 2025 6:39 pm ET3min read
CRWV--
CoreWeave (CRWV) recently demonstrated significant upward momentum, gaining 8.39% in the most recent trading session to close at $163.10. This advance marks the fourth consecutive day of gains, resulting in a cumulative 54.52% rally over this period, as the stock reached an intraday high of $166.63 on robust volume exceeding 55 million shares. Against this backdrop, we conduct a multi-faceted technical assessment of CoreWeave's price dynamics.
Candlestick Theory
The recent price action reveals a robust bullish pattern, characterized by four consecutive white candles with progressively higher highs and higher lows. Particularly noteworthy is the June 4 session, which printed a long lower shadow dipping to $144.30 before closing near the session high – a rejection of lower prices that signals strong demand. Immediate resistance sits at $166.63 (today’s high), while support emerges near $144.30 (today’s low), backed by stronger secondary support at $124.70 from June 3. The absence of clear reversal patterns like doji or engulfing candles suggests continuation potential, though the extended rally increases near-term exhaustion risks.
Moving Average Theory
The moving average configuration confirms a powerful bullish trend across timeframes. Prices maintain decisive positioning above all key averages, with the 50-day MA sloping upward near $85 and the 100-day MA near $70. The shorter-term 20-day MA at approximately $120 accelerates northward, creating a bullish alignment where shorter MAsMAS-- lead longer ones. This structureGPCR-- indicates sustained upward momentum, though the significant gap between current prices and the 50-day MA (~90% premium) warrants monitoring for potential mean-reversion tendencies. Consecutive closes above these dynamic supports reinforce the trend’s integrity.
MACD & KDJ Indicators
Momentum oscillators reflect strong bullish energy but signal overextended conditions. The MACD histogram remains elevated in positive territory, with the MACD line holding well above its signal line – a configuration favoring trend continuation. However, the KDJ registers overbought readings, with the %K and %D lines flattening near 90. While no bearish crossover is evident, divergence risks emerge if price advances decelerate. These indicators collectively suggest upside momentum persists, but the overbought KDJ implies limited additional near-term runway before consolidation.
Bollinger Bands
Volatility expansion dominates the Bollinger Band profile, with the June 4 close pressing against the upper band near $166. The 20-day bands exhibit pronounced widening – the upper band now at ~$155 (+25% above middle band) versus lower band at ~$90. This signals strong directional conviction but historically precedes short-term pullbacks when price deviates excessively from the 20-day SMA. Continued upper-band tagging without rejection may indicate sustained momentum, though reversion toward the $130-$140 band midline appears increasingly probable.
Volume-Price Relationship
Volume dynamics strongly validate the recent breakout. The four-day 54% surge occurred alongside escalating volume, peaking at 55 million shares today – the highest since early April. This accumulation phase confirms institutional participation. Notably, preceding rallies (e.g., May 16-21’s 45% gain) similarly saw volume expansion, reinforcing the pattern that CoreWeave’s major advances attract rising trade intensity. The volume profile suggests current price gains are sustainable near-term, though climactic readings above 50M shares often coincide with interim peaks.
Relative Strength Index (RSI)
The 14-day RSI reaches 80.87 – firmly in overbought territory and the highest reading observed in the dataset. While extremes above 80 reflect powerful momentum, they historically precede consolidation phases. The last comparable peak (RSI=79 on April 2) saw a subsequent 27% pullback over eight sessions. Traders should note this warns of waning incremental buying pressure. However, overbought readings can persist in strong trends, meaning RSI divergence (e.g., price higher highs with RSI lower highs) would be required to signal reversal.
Fibonacci Retracement
Applying Fibonacci to the swing low of $50.18 (May 9) and high of $130.76 (May 29) reveals critical levels. The recent pullback bottomed at $114 (June 2) – notably holding above the 23.6% retracement level ($111.70), confirming shallow correction strength. Current extensions indicate resistance near the 161.8% level ($180.58), with interim barriers at the 127.2% level ($152.37), which was surpassed decisively. Downside support clusters at the 38.2% retracement ($99.91), aligning with key moving averages.
Confluence and Divergence
Multiple indicators converge to underscore bullish dominance: volume confirmation, MA alignment, MACD positivity, and shallow Fibonacci retracements collectively validate the uptrend. However, important divergences exist in warning signals: the RSI’s extreme overbought reading conflicts with sustained price gains, while Bollinger Band expansion to historical extremes suggests volatility normalization is pending. KDJ overbought conditions similarly flag exhaustion risks not yet evident in price action. These divergences support a near-term consolidation scenario without invalidating the broader uptrend.
Probabilistic Outlook
The technical structure heavily favors continued upside in the intermediate term, supported by volume conviction, MA alignment, and shallow corrections. However, the confluence of RSI >80, extended Bollinger Band deviation, and significant premium to key MAs (~90% above 50-day MA) indicate elevated near-term pullback probability. A retracement toward the $140-$150 Fibonacci consolidation zone could develop before challenging the $180.58 extension level. Traders might consider $114 as critical trailing stop support, as a decisive break below this Fibonacci 23.6% level would jeopardize the near-term bullish thesis.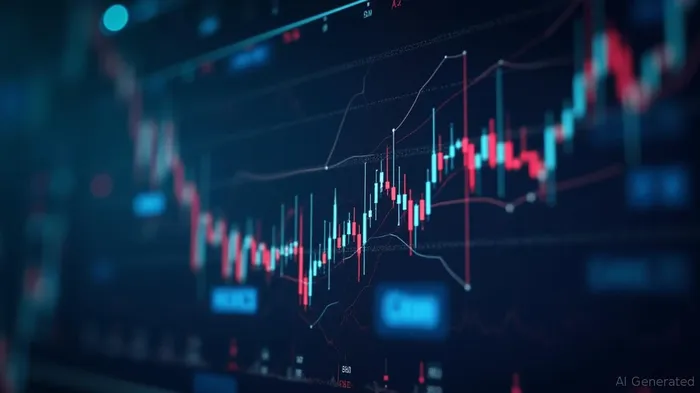
If I have seen further, it is by standing on the shoulders of giants.
Latest Articles
Stay ahead of the market.
Get curated U.S. market news, insights and key dates delivered to your inbox.
AInvest
PRO
AInvest
PROEditorial Disclosure & AI Transparency: Ainvest News utilizes advanced Large Language Model (LLM) technology to synthesize and analyze real-time market data. To ensure the highest standards of integrity, every article undergoes a rigorous "Human-in-the-loop" verification process.
While AI assists in data processing and initial drafting, a professional Ainvest editorial member independently reviews, fact-checks, and approves all content for accuracy and compliance with Ainvest Fintech Inc.’s editorial standards. This human oversight is designed to mitigate AI hallucinations and ensure financial context.
Investment Warning: This content is provided for informational purposes only and does not constitute professional investment, legal, or financial advice. Markets involve inherent risks. Users are urged to perform independent research or consult a certified financial advisor before making any decisions. Ainvest Fintech Inc. disclaims all liability for actions taken based on this information. Found an error?Report an Issue

ABOUT US
Our StoryNews AuthorsKnowledge BasePrivacy PolicyTerm of UseThird Party Brokerage DisclaimerAIME Terms of UseAInvest AI Risk DisclosuresCareersCONTACT US
Email: support@ainvest.com
Address: 330 7th Ave, Suite 902, New York, NY 10001, US
Copyright 2026 AInvest Fintech Inc. All rights reserved.
Comments
No comments yet