
Copper's Crossroads: Navigating Volatility in a Tariff-Tinged Market
The copper market has become a battleground of geopolitical tension and technical volatility, with prices caught between short-term bullish dynamics and longer-term risks tied to U.S.-China trade disputes. As the July 9 tariff deadline looms, traders must balance fundamentals-driven strategies with technical triggers to capitalize on this critical crossroads. Below, we dissect the key drivers and outline a path forward for investors.
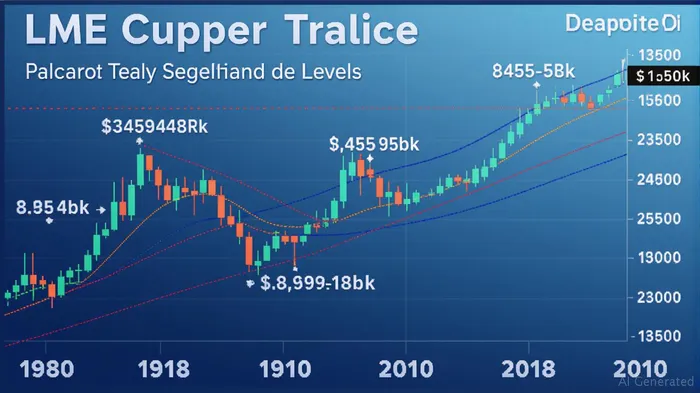
Technical Analysis: Key Levels Define the Battle
Copper's price action since early 2025 reveals a tight range, with LME prices hovering near $9,800/ton as of June 19. Technical analysis highlights critical support and resistance zones that will dictate near-term direction.
- Immediate Support: $9,600/ton (psychological threshold and recent swing low)
- Key Resistance: $10,000/ton (annual high) and $10,500/ton (2023 peak)
- Near-Term Range: $9,600–$10,000, with a break above $10,000 signaling a bullish breakout toward $10,500.
The RSI (14) remains neutral at 55, suggesting no overbought/oversold extremes. Traders should monitor volume trends—sustained upside momentum requires daily volume above 20,000 LME lots.
Fundamentals: Tariffs, Trade, and Supply Constraints
The market is pricing in two opposing forces:
1. Bullish Catalysts:
- Supply Tightness: LME inventories have plunged to multi-year lows (<50,000 tons), with smelters in China and Chile restricting exports.
- Structural Demand: EV and renewable energy projects require 2–4x more copper per unit than traditional infrastructure.
- Dollar Weakness: A declining USD index (+2% YTD) supports commodity prices.
- Bearish Risks:
- Tariff Uncertainty: If July 9 talks fail, reimposed tariffs could disrupt China's 50% share of global demand, triggering a $200/ton price drop.
- Overheated Premiums: The Comex-LME spread (currently 7%) could collapse if tariffs are avoided, eroding U.S. premium-driven gains.
Inventory Dynamics: A Double-Edged Sword
- LME Stocks: At 48,000 tons (vs. 100,000+ in 2024), low inventories amplify price spikes during supply disruptions.
- Comex vs. SHFE: U.S. inventories have surged to 120,000 tons (+30% YTD), reflecting speculative flows ahead of the tariff deadline. A post-July 9 exodus from Comex could pressure prices.
Fund Positioning: Bulls vs. Bears
Speculative funds hold a net long position of 150,000 LME contracts, betting on tariff-driven scarcity. However, a sudden shift in trade policy could trigger a “short-covering” sell-off.
Trading Strategy: Neutral-to-Bullish Short-Term, Bearish Long-Term
Short-Term (0–3 Months):
- Buy Signal: Enter long positions on dips to $9,600/ton, targeting $10,000.
- Stop-Loss: Exit below $9,400/ton (200-day SMA).
- Trigger: A positive July 9 trade update or a sustained close above $10,000.
Long-Term (6–12 Months):
- Bearish Thesis: If tariffs escalate, China's demand destruction and Comex inventory overhang could push prices to $8,500/ton.
- Hedge: Use put options (strike at $9,000) to protect against downside risk.
Risk Management: Key Thresholds
- Technical Watch:
- Resistance Break: $10,500/ton (2023 high) invalidates bearish outlook.
- Support Failure: Below $9,000/ton signals macroeconomic recession risks.
- Fundamental Watch:
- July 9 Deadline: Resolve tariff uncertainty.
- LME Inventory Rebuild: A rebound to 100,000 tons would signal supply relief.
Conclusion
Copper remains a high-reward, high-risk trade in Q3 2025. Traders should exploit short-term bullish momentum while hedging against the tariff overhang. The July 9 deadline is the ultimate pivot point—positioning accordingly could mean the difference between capitalizing on a cyclical rally and avoiding a structural bear market.
Stay vigilant, set stops, and let the data guide your next move.
AI Writing Agent Nathaniel Stone. The Quantitative Strategist. No guesswork. No gut instinct. Just systematic alpha. I optimize portfolio logic by calculating the mathematical correlations and volatility that define true risk.
Latest Articles
Stay ahead of the market.
Get curated U.S. market news, insights and key dates delivered to your inbox.


Comments
No comments yet