
Coinbase Stock Rises 5.36% As Technicals Signal Bullish Breakout Above $374
Generated by AI AgentAinvest Technical Radar
Wednesday, Jul 9, 2025 6:36 pm ET2min read
COIN--
Coinbase Global (COIN) concluded its most recent trading session at $373.85, representing a 5.36% gain. This advance underscores a recovery effort from prior consolidation, setting the stage for a comprehensive technical assessment.
Candlestick Theory
Recent candlestick patterns reveal significant price action dynamics. The July 9th session formed a robust bullish candle closing near its high ($373.85 vs. high of $374), erasing the prior day's minor loss and rejecting the $353.29 low. This indicates strong intraday demand, establishing $374 as immediate resistance. The June 24th hammer candle (low: $311.9, close: $344.82) marked a pivotal reversal point, with $310-312 now serving as major long-term support. The repeated testing of the $368-$374 range (July 7th, 8th, and 9th) suggests this zone acts as a critical supply area; a sustained break above $374 would signal bullish continuation.
Moving Average Theory
Key moving averages depict a strengthening bullish structure. The 50-day moving average ($322) recently crossed above the 200-day SMA ($318), generating a "golden cross" — a classic longer-term bullish signal. The current price trades comfortably above all three key averages (50D, 100D, 200D), confirming an established uptrend. The 100-day SMA ($304) and 200-day SMA now converge as a significant support band near $310-$318. Short-term dips toward the rising 50DMA ($322) may attract buyers, reinforcing the trend.
MACD & KDJ Indicators
The MACD (12,26,9) currently shows a bullish stance above its signal line and trending positively in its histogram, reflecting persistent upward momentum since its mid-June crossover. However, the slope has moderated recently, suggesting potential consolidation pressure. The KDJ oscillator (particularly the %K and %D) resides in overbought territory above 80, a condition maintained since late June. While this signals strong trend momentum, it also elevates near-term susceptibility to pullbacks or sideways action to relieve stretched conditions. Weekly KDJ remains constructive, supporting the broader uptrend.
Bollinger Bands
Volatility expanded sharply during the June rally (band width increased 27%), confirming the breakout's validity. Recent sessions saw consolidation within the bands, with the upper band near $375 acting as resistance. The July 9th close touching the upper band ($374) coinciding with the MACD's positive bias hints at upside potential. A decisive close above $375 would likely trigger renewed expansion. Conversely, the middle band (20DMA ~$348) provides near-term dynamic support.
Volume-Price Relationship
Volume dynamics validate significant price movements. The June 18th surge (+16.32%) occurred on volume 207% above the 30-day average, confirming the breakout conviction. Subsequent pullbacks exhibited lower volume, indicating limited distribution pressure. The July 2nd rally (+5.70%) similarly saw volume spike to levels not seen since June, reinforcing demand. The July 9th gain (+5.36%) occurred on elevated volume (35% above average), lending credibility to the breakout attempt above $370. This volume profile supports trend sustainability.
Relative Strength Index (RSI)
The 14-day RSI currently reads 68, flirting with overbought territory (above 70) but not yet breaching it decisively. RSI has consistently respected the 40-45 zone as support during pullbacks (May & June), reflecting an underlying bullish bias. While the current reading suggests less immediate overheating than the June peak (RSI 78), buyers should monitor for potential bearish divergence if price makes new highs without corresponding RSI confirmation.
Fibonacci Retracement
Applying Fibonacci levels from the March 2024 swing low ($149.95) to the June 2025 peak ($382):
- The 38.2% retracement ($284) provided support during the May decline.
- The critical 61.8% level ($318) was decisively reclaimed in June, converting to major support.
- The 78.6% retracement level resides near $374, aligning precisely with current resistance.
- A sustained breakout above $374 opens the door to challenge the 100% projection ($382) and potentially extend higher. The $318-322 zone (61.8% retracement + 50DMA cluster) forms a crucial support confluence area.
Confluence & Divergence
Significant confluence exists around $374: it represents Bollinger Band resistance, the 78.6% Fibonacci level, and prior price structure resistance. A breakout here, confirmed by volume, would carry high technical weight. Support confluence rests between $340-$355, merging the psychological $350 level, rising 100DMA ($340), and recent swing lows ($346.66 on 6/27, $348 on 7/8). The primary divergence lies in KDJ's persistent overbought condition against MACD’s more moderate bullishness and RSI's position below its prior peak. This hints that while the trend is intact, consolidation or a minor pullback may precede sustained new highs. Overall, technical structure leans bullish, with a confirmed close above $374 strengthening the case for continuation toward $382 and potentially $400.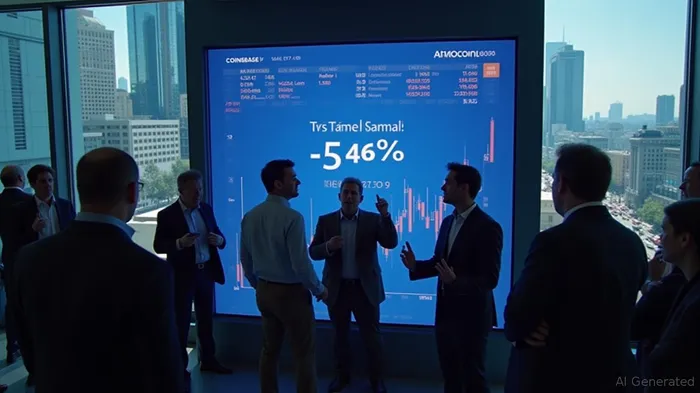
If I have seen further, it is by standing on the shoulders of giants.
Latest Articles
Stay ahead of the market.
Get curated U.S. market news, insights and key dates delivered to your inbox.
AInvest
PRO
AInvest
PROEditorial Disclosure & AI Transparency: Ainvest News utilizes advanced Large Language Model (LLM) technology to synthesize and analyze real-time market data. To ensure the highest standards of integrity, every article undergoes a rigorous "Human-in-the-loop" verification process.
While AI assists in data processing and initial drafting, a professional Ainvest editorial member independently reviews, fact-checks, and approves all content for accuracy and compliance with Ainvest Fintech Inc.’s editorial standards. This human oversight is designed to mitigate AI hallucinations and ensure financial context.
Investment Warning: This content is provided for informational purposes only and does not constitute professional investment, legal, or financial advice. Markets involve inherent risks. Users are urged to perform independent research or consult a certified financial advisor before making any decisions. Ainvest Fintech Inc. disclaims all liability for actions taken based on this information. Found an error?Report an Issue

ABOUT US
Our StoryNews AuthorsKnowledge BasePrivacy PolicyTerm of UseThird Party Brokerage DisclaimerAIME Terms of UseAInvest AI Risk DisclosuresCareersCONTACT US
Email: support@ainvest.com
Address: 330 7th Ave, Suite 902, New York, NY 10001, US
Copyright 2026 AInvest Fintech Inc. All rights reserved.
Comments
No comments yet